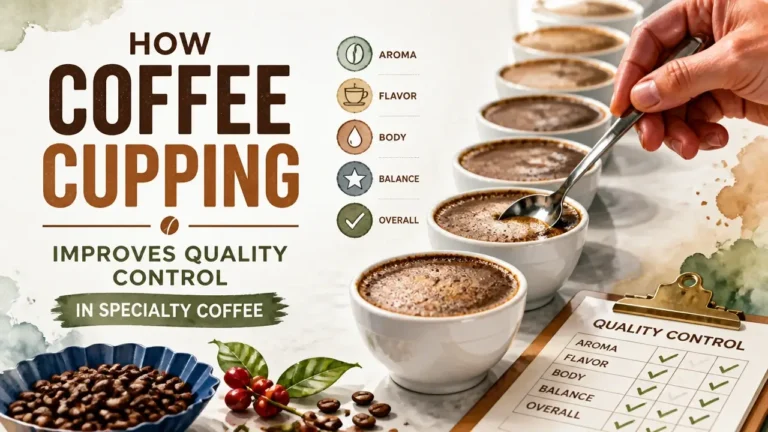

Rigorous coffee cupping does something green grading cannot: it reveals what actually happened to a lot between harvest and your loading dock. Screen size tells you the bean is big. A cupping table tells you whether it still tastes like the coffee you agreed to buy.
For quality managers sourcing across dozens of origins, that distinction is the difference between a container you can sell and one you have to explain. This article maps the mechanism behind cupping-driven QC, from sample integrity to feedback loops, so you can build a system that catches problems before they reach the customer.
Key Takeaways on How Coffee Cupping Improves Quality Control
- Physical green grading cannot detect flavor taints or lot degradation; cupping is the only instrument that catches those failures.
- The SCA cupping protocol’s value is repeatability: identical preparation conditions mean sensory differences reflect the coffee, not the method.
- A pre-shipment sample that looks unusually clean warrants skepticism; hand-cleaning of trade samples is a widespread and underacknowledged practice.
- A four-point cupping score variance can represent over $1.70 per pound, making calibrated scoring a direct profit-and-loss function, not a sensory exercise.
- Team calibration is not optional; without it, scoring drift gradually causes your QC system to measure your team’s palate variation rather than the coffee.
- Sporadic cupping catches crises; daily cupping prevents them. The feedback loop only works when cupping is as routine as roasting.
The Real Gaps in Specialty Coffee Quality Control
Quality control in specialty coffee is the discipline of ensuring every lot consistently hits a predefined flavor, aroma, and defect-free profile. Passing a physical grade is a prerequisite, not the destination. Yet most QC programs still treat green grading as the primary gate, which leaves a structural blind spot that only a serious cupping practice can close.
The standard toolkit has two layers. First, green grading: screen size, moisture content, defect count. These are measurable, repeatable, and useful for establishing physical baselines. Second, sensory evaluation through cupping. The problem is that physical grading cannot detect flavor taints, process faults, or the slow sensory degradation that happens during transit and warehousing. A lot can pass every physical threshold and still taste like wet cardboard by the time it arrives at your roastery.
This is where lot integrity becomes the operative concept. Coffee’s sensory profile is not static. It shifts during transport, extended warehousing, and milling. A lot cupped at origin in January is not guaranteed to cup the same way in a Hamburg warehouse in April. Cupping is the only instrument sensitive enough to catch that drift.
The trade structure compounds the problem. Most purchasing decisions rest on pre-shipment samples, small parcels drawn before the container is sealed. The buyer cups the sample, approves the lot, and the shipment moves. By the time arrival cupping happens, weeks or months have passed. That gap is where informational asymmetry lives, and it is where quality managers get burned.
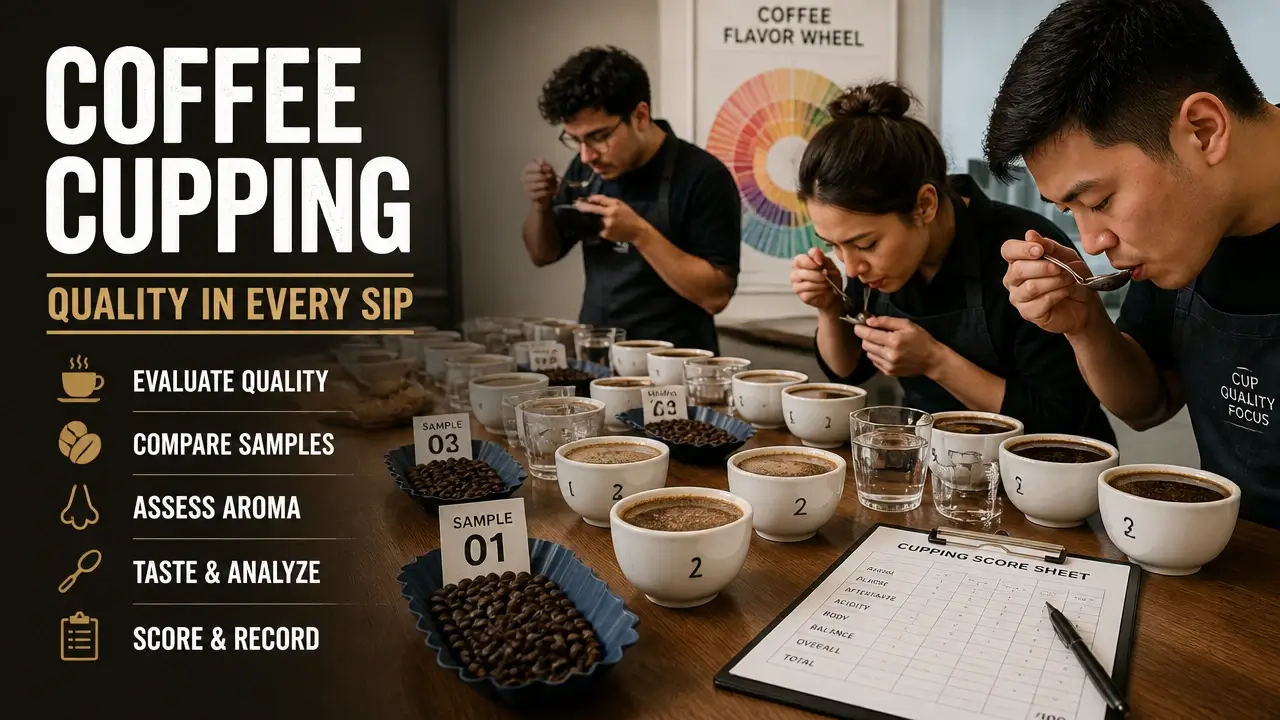
The SCA provides the industry’s essential quality benchmarks, but the governance structure behind those standards is worth understanding clearly. The SCA Standards Development Panel, which is the body that green coffee standards flow from, consists of five voting members representing five stakeholder categories: Board, Farming/Processing, Trading, Roasting, and Brewing. No disclosure of geographic origin or smallholder representation exists in the public record. The rules that define “specialty” are shaped by a small, centralized group. For a quality manager, this is not a reason to discard the standards. It is a reason not to treat them as an infallible quality oracle. They are a consensus baseline. An internally-driven cupping program is what fills the gaps they leave.
That gap has a name in the trade. Krzysztof Blinkiewicz, founder of the coffee education platform Red Ink Coffee, authorized SCA Trainer, and Q grader, describes it plainly:
Blinkiewicz defines “pointwashing” as the inflation or misrepresentation of coffee scores, whether deliberate or accidental, to assign a coffee more commercial value than its sensory reality justifies. The mechanism is simple: a score drifts up, a buyer pays a premium, and the cup in the bag doesn’t match the number on the contract.
Pointwashing matters because it is not always malicious. Scoring drift within a cupping team, inconsistent calibration, and the psychological pull of a relationship with a producer can all push numbers upward without anyone intending fraud. The result is the same: a QC system that measures itself rather than the coffee.
The producer side of the equation carries its own asymmetry. Mbula Musau, Q Arabica instructor and founder of Utake Coffee, makes the case that producers who understand cupping can align their processing decisions with the market’s actual quality requirements, which directly improves their earnings. When producers lack that feedback, they are optimizing blind.
Musau argues that teaching farmers to read cupping results is a form of genuine capacity building. A producer who understands why a fermentation note costs them points can adjust their protocol. One who only hears “the score was low” cannot.
This is the systemic vulnerability your QC program has to address. The standards define the floor. Cupping, wielded as a proactive and critical instrument rather than a compliance checkbox, is what builds the ceiling.
The Cupping Audit Trail: Bridging the Gap Between Origin Sample and Arrival Lot
Arrival cupping failures are almost never random. They trace back to one of two causes: a breakdown in the cupping protocol itself, or a compromised sample that the protocol was never designed to detect. Understanding which gate failed tells you exactly where to fix the system.
Cupping earns its role as a QC instrument by operating at every critical stage of the supply chain, not just at the roastery door.
How Each Supply Chain Gate Uses Cupping
At the farm, cupping identifies which micro-lots show enough sensory potential to justify the extra handling and separation costs. It is a selection tool, not yet a quality assurance gate.
At the mill, cupping quality-assures the processing and sorting work. A washed lot that cups phenolic at the dry mill signals a fermentation problem upstream. Catching it here is cheap. Catching it after shipment is expensive.
At the exporter, cupping is the final sensory sign-off before the container is sealed. This is where the pre-shipment sample is drawn and approved. The exporter’s cupping result is the benchmark your arrival lot will be measured against.
At the roastery, the pre-shipment sample and the arrival lot are cupped side by side. Deviations from the approved profile trigger price adjustments or rejections. This comparison is only meaningful if both samples were handled under identical conditions and evaluated under the same protocol.
Why the SCA Protocol Creates a Repeatable Baseline
The SCA cupping protocol specifies water temperature at 93°C, a grind size calibrated to the cupping standard, and a coffee-to-water ratio of 8.25g per 150ml. These parameters are not arbitrary. They create a stable, reproducible extraction environment so that sensory differences between lots reflect the coffee, not the preparation. When your arrival cupping deviates from the pre-shipment result, you can be confident the coffee changed, not the method.
Multiple Bowls as a Risk Management Tool
A single bowl per sample is not enough for arrival cupping. The standard practice of running five bowls per lot exists because sporadic defects, ones that affect a percentage of bags rather than the entire container, will not appear in every bowl. A lot with one tainted bowl in five is a different risk profile than a lot with five tainted bowls in five. That distinction drives the decision: partial downgrade versus rejection. Three bowls is the minimum for meaningful risk assessment. Five is the standard for high-value or high-volume lots.
Blind evaluation at this stage is non-negotiable. Knowing you paid a premium for a lot creates purchase bias. The cupper who knows the origin, the price, and the producer relationship will score differently than one who doesn’t. Blind coding removes that variable and forces an objective judgment of whether the coffee in the bowl matches the approved profile.
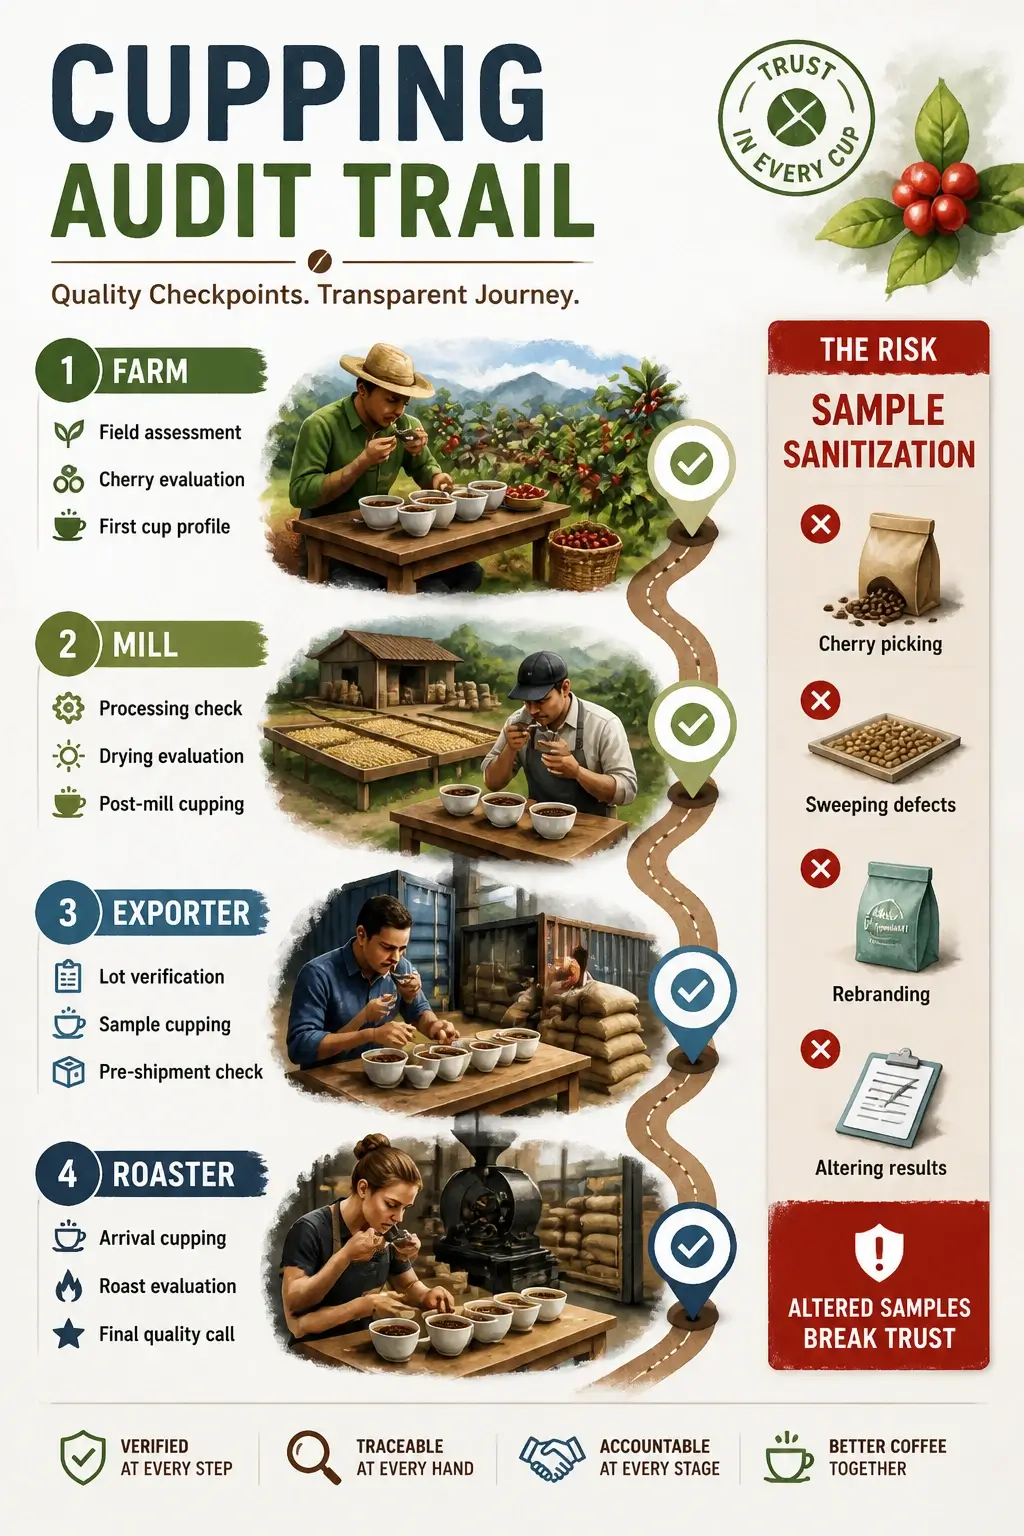
Here is the gap that protocol alone cannot close. A widespread practice in green coffee trade is the hand-cleaning of pre-shipment samples: sellers meticulously remove visible defects from a 100–300g parcel before it goes to the buyer. The sample cups clean. The buyer approves. Months later, ten 60kg bags arrive and the coffee looks, and cups, noticeably less clean than the sample suggested. The SCA’s standards framework does not address sample honesty as a certifiable requirement, and most internal QC programs overlook it entirely.
The practical defense is straightforward. Build arrival spot-checks into your standard operating procedure. Treat any sample that looks unusually clean with proportional skepticism. Over time, track the delta between pre-shipment and arrival scores by supplier. A supplier whose samples consistently outperform their arrivals is telling you something important about their sample preparation practices.
Reading the Warning Signs: How Cupping Detects Taints and Faults
Cupping’s defect vocabulary gives quality managers a shared language for turning a vague “something’s wrong” into an actionable diagnosis. The distinction between a taint and a fault is not semantic. It carries direct economic consequences.
Taint vs. Fault: The Economic Boundary
Under the SCA cupping form, a taint is a minor off-flavor that detracts from the cup. It incurs a penalty of −2 points per affected cup but does not automatically disqualify the lot from specialty. A fault is a major, often overwhelming defect that dominates the profile. A faulted cup is marked zero for that attribute and, in practice, renders the lot unfit for specialty classification.
The difference between a −2 taint and a fault can mean the difference between a discounted sale and a rejected container.
Sensory Markers and What They Point To
Concrete sensory examples make this actionable:
- Phenolic (medicinal, band-aid, smoky): associated with microbial contamination during fermentation or contact with phenolic compounds during processing or drying
- Sour/fermented (vinegar, overripe fruit): points to over-fermentation, typically from excessive time in the fermentation tank or inconsistent temperature control
- Rubbery: often linked to robusta contamination or severe over-fermentation
- Musty/moldy: signals moisture damage during storage or drying that was halted too early
The biochemistry behind phenolic taints is well-documented. A peer-reviewed study in Food Chemistry identified 4-ethyl-2-methoxyphenol as a volatile marker compound specifically elevated in scorched roast defects, a phenolic compound chemically related to the fermentation-derived 4-ethylphenol. The research established that variations in time-temperature profiles regulate the rate of key biochemical pathways, including Maillard chemistry, caramelization, oxidation, and pyrolysis, which drive the formation of these defect-associated compounds.
The study found that specific volatile phenolic compounds serve as reliable chemical markers for distinct roast defects, with their concentrations directly regulated by time-temperature deviations during roasting – From the study “Determination of volatile marker compounds of common coffee roast defects“
This matters practically: when your cupping team flags a phenolic note, the source could be fermentation, processing, or roast execution. The sensory marker alone narrows the field. Cross-referencing with lot history, roast logs, and processing records identifies the root cause.
Why Protocol Isolation Matters for Defect Detection
The standardized cupping protocol removes brewing variables as confounding factors. When every sample is prepared identically, a phenolic note in bowl three cannot be explained away by inconsistent grind or water temperature. The defect is in the coffee. That certainty is what makes cupping a credible diagnostic tool rather than a subjective impression.
A single tainted bowl in a flight of five is enough to flag an inconsistent lot for closer inspection or partial rejection.
Team Calibration Is the Only Reliable Instrument
The SCA’s written definitions do not provide a hard numeric threshold between taint and fault. The distinction relies on the cupper’s judgment. One cupper calls a mild rubbery note a −2 taint; another marks it a fault. When a lot is sitting at 80.5 points, that disagreement has direct financial consequences.
Internal team calibration is the only mechanism that closes this gap. Regular calibration sessions using reference coffees with known defect profiles align the team’s sensory thresholds. Without them, scoring drift is inevitable, and your QC system gradually stops measuring the coffee and starts measuring the variation in your team’s palates.
The Scorecard That Moves Markets: How Cupping Numbers Drive Value
Cupping scores on the 100-point scale are the common language of specialty coffee trade. They translate sensory reality into a number that purchasing managers, contract terms, and pricing models can act on. Understanding the scale’s structure, and its assumptions, is a core competency for anyone managing quality at scale.
How the 100-Point Scale Maps to Market Tiers
The scoring tiers work as follows:
| Score Range | Classification | Market Implication |
|---|---|---|
| 90–100 | Exceptional / Outstanding | Rare, commands significant premium |
| 85–89.9 | Excellent | High-end specialty, auction lots |
| 82–84.9 | Very Good | Standard specialty range |
| 80–81.9 | Good | Specialty floor |
| Below 80 | Below Specialty Grade | Commercial grade |
The 80-point floor is not a soft guideline. It is the hard threshold below which a coffee cannot be marketed as specialty. Every point above that floor carries real economic weight.
Score Variance as a Profit-and-Loss Variable
The price differential across the specialty range is significant. Data from the 2023/24 harvest year illustrates the stakes:
The median price for green specialty coffee scoring between 86 and 87.9 points was $4.38 per pound, while the median price for coffee scoring between 82 and 83.9 points was $2.65 per pound – a $1.73 per pound difference for a four-point range in cupping scores. – Source: Specialty Coffee Transaction Guide
On a standard 275-bag container of 60kg bags, that four-point scoring variance translates to roughly $57,000 in price difference. Precise, calibrated scoring is not a sensory exercise. It is a direct profit-and-loss function.
Scores as Contractual Instruments
Roasters and buyers embed cupping scores into contract terms. A pre-shipment sample approval at 86 points creates a contractual expectation. If the arrival lot cups at 83, the buyer has grounds for a price adjustment or rejection. This mechanism only functions if both parties cup under the same protocol and against the same reference standards, which is another argument for inter-party calibration.
What the Score Actually Aggregates
The 100-point score is not a single judgment. It aggregates discrete attributes: fragrance, aroma, flavor, aftertaste, acidity, body, balance, uniformity, clean cup, and sweetness. Each attribute is scored separately, and the total reflects the coffee’s holistic sensory profile. A simple defect count cannot replicate this. A coffee with zero physical defects but poor balance and a thin body will score in the low 80s. A coffee with a handful of minor physical imperfections but exceptional complexity can score in the high 80s. Cupping captures what grading screens cannot.
One persistent market assumption is worth challenging directly: the belief that larger beans cup better. Multiple industry taste tests have found no reliable correlation between bean size and cup quality. The genuine technical priority is homogeneity. Beans of uniform size roast more evenly. A mix of large and small beans in the same drum leads to uneven development and the off-flavors that come with it. The market still prices AA and Supremo grades at a premium. For a quality manager, this is a concrete cost-saving insight: money spent on large-bean premiums may not improve cup quality. Investing in lots with proven high cupping scores and consistent screen-size distribution yields better return than paying for size alone.
Blending with Purpose: How Cupping Data Informs Roast Profiles
Cupping notes from individual lots are more than a quality verdict. They are a functional map of what each origin contributes to a finished blend. A quality manager who reads them that way can build blends with precision instead of intuition.
The workflow starts with attribute mapping. A bright, high-acidity Ethiopian lot with light body and floral notes functions as the blend’s top register. A heavy-bodied Brazilian natural with low acidity and chocolate sweetness provides the base. A clean, balanced Colombian fills the middle. These are not aesthetic choices. They are engineering decisions driven by cupping data.
Understanding who uses coffee cupping across the supply chain makes this clearer: Q graders at origin, exporters, roasters, and buyers all read the same cupping form, but for different purposes. At the blending stage, the roaster’s purpose is architectural.
The Iterative Blending Workflow
The process runs in cycles. Start with small-scale roast trials on a sample roaster, typically 100–200g batches, to test proposed blend ratios without committing production volume. Cup each trial blind against the target sensory profile. Adjust ratios based on what the cup reveals: too bright, reduce the Ethiopian percentage; too flat, reduce the Brazilian and add a washed Central American. Repeat until the blend cups within range of the target.
Roast degree is a variable in this equation, not a fixed parameter. A lot’s cupping profile often signals the optimal roast approach. High acidity and light body typically respond better to a shorter development time that preserves brightness. Heavy, low-acid lots can tolerate longer development. Cupping after each roast profile adjustment confirms whether the change moved the cup in the intended direction.
Cupping as a Gatekeeper
Cupping also defines what stays out of core blends. A lot that cups cleanly but one-dimensionally, all body and no complexity, may perform adequately in a commodity blend but will flatten a specialty blend designed around complexity. Defective lots with persistent taints are excluded regardless of their physical grade. The cupping table makes these calls before production scale-up, not after.
Post-blend cupping is the final verification step. Once the blend is approved at small-scale trial, a full production roast is evaluated against the target profile before the product ships. This closes the loop between the design decision and the delivered product.
Co-Fermented Coffees Require Extra Diligence
Modern processing experiments have introduced a variable that challenges standard blending logic. Co-fermented coffees, where additional carbohydrates or fruit are introduced during fermentation to create distinctive flavor compounds, produce intense, sometimes artificial-tasting profiles. These lots are notoriously difficult to both cup and blend. Their unusual flavor compounds can dominate a blend in ways that are hard to predict from a single cupping session, or they can fade rapidly post-roast as volatile compounds dissipate.
For a quality manager, the standard cupping protocol is not sufficient for these lots. Supplement it with longer-term aging trials and accelerated staling tests before committing a co-fermented lot to a core blend formulation. A co-fermented lot that cups spectacularly at origin and falls apart on the retail shelf is a direct cupping-to-QC failure.
Closing the Loop: From Cupping Notes to Processing and Roasting Improvements
The feedback loop between cupping results and upstream decisions is what separates a cupping program that generates data from one that generates improvement. Without a structured mechanism for translating cupping findings into corrective action, scores accumulate in a spreadsheet and nothing changes.
The cycle works as follows. A recurring taint or score dip in cupping triggers a trace-back to the probable source. On the farm side, the candidates are picking practices, fermentation protocol, and drying conditions. At the mill, the candidates are sorting efficiency and storage environment. In the roastery, the candidates are charge temperature, development time, and airflow.
A Concrete Trace-Back Example
A persistent grassy note appearing across multiple lots from the same washing station is a specific signal. Grassy flavors in coffee typically point to under-ripe cherry or incomplete drying, two root causes with different interventions. If harvest timing is the issue, the corrective action is adjusted picking protocols: stricter selective picking, higher brix thresholds for cherry acceptance, or delayed harvest start dates. If incomplete drying is the cause, the corrective action is extended drying time or improved airflow on raised beds.
Neither intervention is possible without the feedback. A quality manager who cups the flaw, names it precisely, traces it to the washing station, and communicates the finding to the producer creates a direct line between sensory detection and agricultural improvement. The following season’s lots reflect that correction.
Closing the Loop on the Roasting Side
Cupping after roast profile changes performs the same function inside the roastery. If a lot cups harsh and astringent after a standard profile, the likely cause is under-development or too-rapid heat application in the early Maillard phase. Adjust the charge temperature or extend development time by 15–20 seconds. Cup the adjusted roast against the original. The cup either confirms the fix or points to a different variable.
This is root-cause analysis applied to roast execution. Without cupping as the measurement instrument, roast adjustments are guesses. With it, they are hypotheses with testable outcomes.
Documentation Is Not Optional
The feedback loop breaks without systematic recording. A cupping finding that lives only in a cupper’s memory cannot be trended, shared with a producer, or compared to last year’s harvest. Logging scores, descriptors, and lot identifiers into a shared database is what transforms individual cupping sessions into institutional knowledge. Trend analysis across multiple seasons reveals whether a producer’s quality is improving, declining, or holding steady, which directly informs purchasing decisions and relationship investment.
Inside the Roastery: A Cupping-Driven QC Workflow [Case Study]
A cupping-driven QC system in a functioning roastery is not a theoretical construct. It is a repeatable weekly rhythm built on strict protocol, blind evaluation, and systematic documentation. Here is what it looks like in practice.
The Operating Environment
A specialty roastery sourcing 20+ origins employs a head cupper who leads a team of two additional trained cuppers. Every incoming pre-shipment sample and every arrival lot is cupped under SCA protocol. Samples are coded blind before sessions begin. No one at the cupping table knows which lot is in which bowl until scoring is complete.
The Weekly Rhythm
Monday starts with a calibration session. The team cups a reference coffee with a known, documented profile, one they have cupped dozens of times. The goal is not to evaluate the coffee. The goal is to align the team’s palates and confirm that everyone’s scoring is consistent before the week’s evaluation work begins. Any cupper whose scores drift more than two points from the team median on the reference coffee flags a conversation.
Tuesday through Friday, arrival lots are cupped in sessions of four to six lots, with five bowls per lot. Scores and descriptors are logged into a shared database immediately after each session, before discussion. Post-session discussion happens after scores are recorded to prevent social anchoring, the tendency for a junior cupper to adjust their score toward the most senior voice in the room.
A Decisive Moment
A high-scoring Ethiopian lot arrives, pre-shipment approved at 87.5 points. During arrival cupping, bowl three of five presents a mild ferment taint: not a fault, but a −2 taint that pulls the lot’s arrival score to 85.0. Physical grading shows nothing unusual.
The team halts production allocation for that lot. They pull the retained pre-shipment sample from cold storage and cup it against the arrival lot, blind, in the same session. The pre-shipment sample cups at 87.5, matching the original approval. The arrival lot cups at 85.0 across all five bowls.
The delta is real and consistent. The conclusion: a shipping or storage event degraded the lot after the pre-shipment sample was drawn. The lot is downgraded. The roastery’s seasonal single-origin offering is protected. The supplier is notified with documentation.
That documentation matters. It creates a traceable record that supports the price adjustment conversation and informs future purchasing decisions about that supplier’s cold chain reliability.
Cupping Data Driving Roast Profiling
The same Ethiopian lot’s cupping profile, high acidity, light body, and bright stone fruit notes, informs the roast approach. The head cupper recommends a shorter development time to preserve the acidity rather than driving it toward a heavier, more chocolatey profile. A trial roast on the sample roaster is cupped the following morning. The result confirms that the shorter development time preserves the brightness without introducing underdevelopment harshness. The profile is approved for production.
This is the compounding value of a cupping database. Over two or three seasons, the roastery builds a library of sensory profiles, roast responses, and supplier reliability data that makes every subsequent buying and roasting decision more informed than the last.
For a practical look at how this kind of session runs in real time, this video from Cat & Cloud Coffee shows their QC cupping process in action:
The Cupping Habit: Building a Daily Practice for Unshakeable Quality
Sporadic cupping produces sporadic quality. The feedback loop described in the preceding sections only functions when cupping is as routine as roasting itself. A cupping program that activates only in response to a complaint or a bad arrival has already failed its primary purpose: catching problems before they reach the customer.
Quality drift is slow and incremental. A roast profile shifts by five seconds of development time. A lot from a familiar supplier comes in slightly drier than usual. A new team member’s palate skews toward lower acidity scores. None of these changes trigger an alarm in isolation. Accumulated over weeks, they produce a product that no longer matches the intended profile, and no one can identify exactly when the drift began.
Daily or near-daily cupping is the detection system for that drift. It creates a continuous baseline. Deviations from that baseline are visible immediately rather than after a customer complaint surfaces them.
The Mechanics of a Sustainable Habit
A cupping habit that survives operational pressure requires structure, not willpower. The practical mechanics:
- Scheduled sessions at a fixed time each day, not slotted in when convenient. Morning sessions before production begins work best because palates are fresh and the results can inform the day’s roasting decisions.
- Rotating team members across sessions to prevent palate fatigue and to cross-train the full team. A QC program that depends on one cupper’s palate is one resignation away from collapse.
- Blind coding of all samples, including production roasts that the team roasted themselves. Familiarity bias is real. Blind evaluation removes it.
- Systematic logging of every session: scores, descriptors, lot identifiers, and any flags. If it isn’t recorded, it didn’t happen as far as the feedback loop is concerned.
Inter-Roastery Calibration Prevents Score Inflation
Alex Taylor, lead barista at The Crown: Royal Coffee Lab and Tasting Room, frames team alignment as a direct operational efficiency tool:
Taylor’s argument is that when a team is calibrated on sensory targets, the result is less waste during the dialing-in process and more consistent output regardless of who is preparing the coffee – the same principle applies directly to cupping teams evaluating quality.
Internal calibration keeps a team aligned. But without inter-roastery calibration, an organization’s scores can drift upward in aggregate over time. Each individual cupper believes they are scoring accurately. Collectively, the team’s 84 has become the industry’s 82. This is the organizational form of the pointwashing problem described earlier.
Regular calibration against external reference standards, whether through SCA-sanctioned calibration events, shared reference coffees with trading partners, or participation in industry cupping competitions, anchors internal scores to an external reality.
A Simple Starting Point
The full system described in this article does not need to be implemented at once. The entry point: start cupping every arrival lot with three bowls and a calibration reference coffee. Log the scores. Do it every time, without exception. Once that habit is established, add production roast evaluation. Then add periodic green sample spot checks. The habit builds on itself.
The benefits and limitations of cupping are worth understanding clearly before scaling a program: cupping is a powerful instrument, but it measures what arrives at the table, not what happens between sessions.
The standard your daily cupping ultimately serves is not the SCA form. It is the drinker at the end of the supply chain. The grading system measures physical and sensory properties. It does not measure flavor experience, provenance, or the trust a customer places in your brand. A cupping-driven QC program that optimizes for scores without reference to the human experience at the other end risks producing technically correct coffee that no one finds compelling.
The daily cupping habit, properly built, keeps the team’s palate calibrated to that human reality. A score is a map. The territory is the cup in the drinker’s hands.
Frequently Asked Questions About How Coffee Cupping Improves Quality Control
How many bowls per lot is enough for a statistically meaningful arrival cupping?
Five bowls is the standard for high-value or high-volume lots because sporadic defects won’t appear in every bowl. Three is the minimum for a meaningful risk assessment; fewer than that and a single clean bowl can mask a contaminated lot.
Can a pre-shipment sample be cupped months after it was drawn and still be a valid benchmark?
Only if it was stored correctly, sealed and refrigerated at stable humidity. A pre-shipment sample that sat at room temperature for three months has degraded independently of the shipment, which invalidates the comparison.
How do you handle a cupping score discrepancy between two trained Q graders on the same lot?
Re-cup the lot blind in a separate session with both graders and a third reference cupper. If the delta persists above two points, treat it as a calibration issue and run a formal calibration session before making a purchasing or contract decision.
At what point does a taint in one bowl out of five justify rejecting the entire lot versus accepting at a discount?
There’s no universal rule, but if the taint is phenolic or fermented and appears in two or more bowls, rejection or significant price renegotiation is warranted. A single mildly tainted bowl in five is typically grounds for a discount and a documented flag, not outright rejection.
How should a quality manager handle co-fermented coffees that cup brilliantly at origin but fade post-roast?
Run accelerated staling tests: cup the roasted coffee at 24 hours, 7 days, and 14 days post-roast before committing the lot to a core blend. Co-fermented coffees can lose their distinctive volatile compounds faster than conventionally processed lots.
Is there a meaningful difference between cupping for purchasing decisions and cupping for production QC?
Yes. Purchasing cupping compares a sample against a contract benchmark or a competitor lot; the stakes are a buying decision. Production QC cupping compares a roasted batch against a sensory target; the stakes are whether a product ships. The same protocol applies, but the decision criteria are different.
How do you prevent a senior cupper’s scores from anchoring the rest of the team during a session?
Record all individual scores before any group discussion begins. The moment scores are shared verbally before being logged, anchoring is already happening. Software tools or even simple paper forms with sealed envelopes work. The rule is: write first, discuss second.
What’s the minimum viable cupping frequency for a small roastery sourcing five to eight origins?
Cup every arrival lot without exception, and cup each production roast at least once per week against the approved profile. Below that frequency, quality drift becomes invisible until a customer surfaces it.
References
- Resolving Discrepancies in Coffee Cup Scores | perfectdailygrind.com
- What Cupping Can Tell Producers About Their Coffee | perfectdailygrind.com
- Dialing In the Dollars: Tips for Serving a High-Value Coffee | perfectdailygrind.com
- Determination of Volatile Marker Compounds of Common Coffee Roast Defects | pmc.ncbi.nlm.nih.gov
- Specialty Coffee Transaction Guide Shows Price Evolution Beyond the New York C Contract | comunicaffe.com