
Precise caffeine content of coffee sits nowhere on your cup – it lives inside the bean’s cellular structure, shaped by species, roast, grind, and how water moved through the grounds. The American Society of Addiction Medicine puts the range at 107 to 420 mg in a single 12-oz serving. That’s nearly a fourfold spread from the same beverage category.
Most people track “cups,” not milligrams. That gap between the unit they count and the dose they’re actually absorbing is where the real confusion begins.
Key Takeaways on Caffeine Content of Coffee
- A single 12-oz cup of coffee can legally and accurately contain anywhere from 107 to 420 mg of caffeine – the range is real, not a data error.
- Caffeine blocks adenosine receptors rather than generating energy; the tiredness returns sharply when it clears because adenosine accumulated during the blocked window.
- The 400 mg/day guideline is a population ceiling for healthy, non-pregnant, non-adolescent adults – it was not built from data on pregnant people, children, slow metabolizers, or people with cardiac conditions.
- A Starbucks Venti brewed coffee delivers approximately 410–415 mg in a single serving, which already exceeds the entire daily adult threshold.
- Pregnancy reduces the safe ceiling to 200 mg/day across all sources because caffeine’s half-life extends to roughly 15 hours in the third trimester, not because sensitivity changes.
- Flavour strength and caffeine dose are separate variables; a bitter, intense brew can contain less caffeine than a mild one if the extraction ratio and bean species differ.
What Caffeine Actually Is
Caffeine is a specific molecule – 1,3,7-trimethylxanthine – classified as a mild central nervous system stimulant and the most widely consumed psychoactive substance of its class on the planet. It doesn’t generate energy. It blocks the signal that tells your brain it’s tired.
Here’s the mechanism. Your brain continuously produces adenosine, a compound that accumulates during waking hours and binds to adenosine receptors to create what physiologists call sleep pressure – the heaviness you feel as the day goes on. Caffeine’s molecular shape is close enough to adenosine’s that it occupies those same receptor sites without activating them. The tiredness signal gets blocked. Alertness isn’t created; it’s unmasked by removing the thing suppressing it. When caffeine clears your system, the adenosine that accumulated during that time binds all at once – which is why the crash feels sharper than a normal tired.
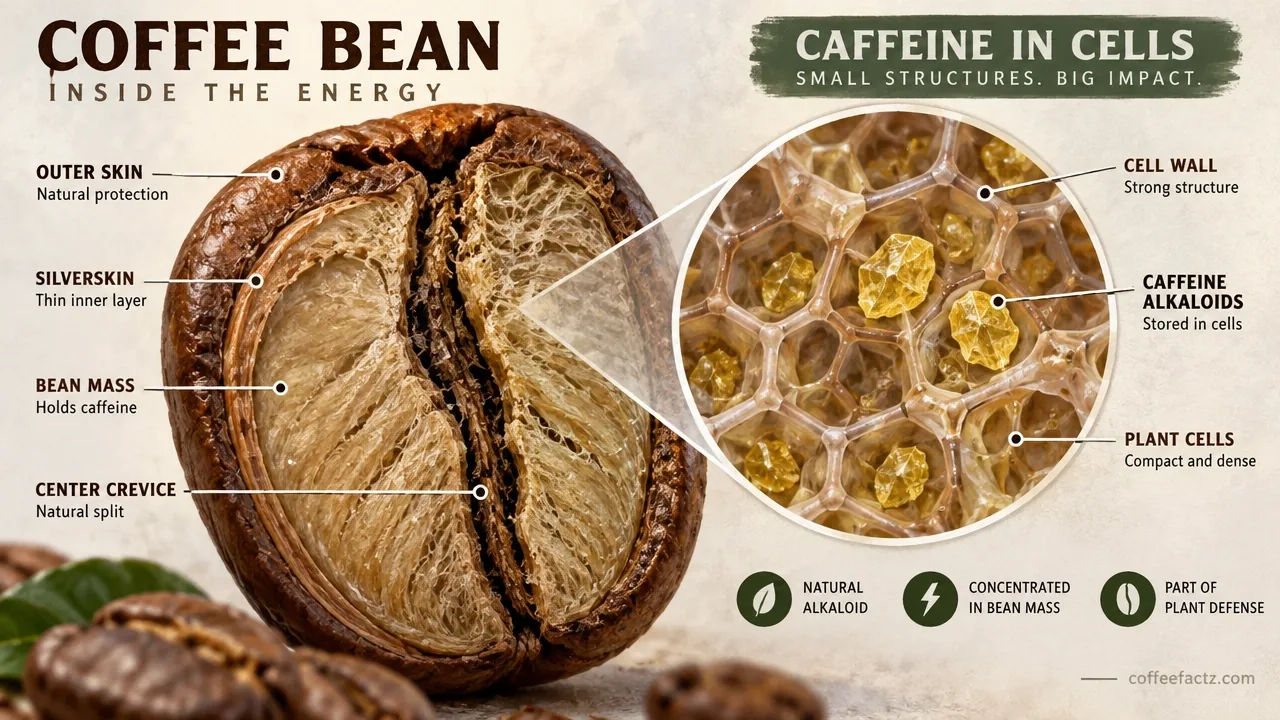
The source of that molecule is the coffee bean itself, where caffeine exists as a plant-defence alkaloid held inside the bean’s cellular structure. The plant produces it to deter insects and inhibit competing seeds from germinating nearby. That cellular packaging matters: caffeine doesn’t just sit loose inside the bean waiting to dissolve. It’s bound within a dense matrix of cell walls, oils, and proteins. How much of it releases into your cup depends entirely on how thoroughly you break that structure open – through grinding, heat, pressure, and contact time.
Roast development changes the bean’s flavour, colour, and moisture content. It does not reliably destroy or create caffeine. The alkaloid is far more heat-stable than the aromatic compounds responsible for taste. What roast actually changes – and why that matters for dose – is covered in the extraction section below.
American Society of Addiction Medicine, publisher of The ASAM Principles of Addiction Medicine, 5th Edition, puts the measurement problem plainly: estimating caffeine exposure is genuinely difficult because of the wide variety of products that contain it, large differences in common serving sizes, and significant variability in caffeine content across products of the same type – even a single 12-oz cup of coffee can contain anywhere from 107 to 420 mg.
That range isn’t a data quality problem. It’s an accurate measure of how variable the inputs are. The same beverage label can mean a fourfold difference in the dose you’re actually consuming, depending on bean, roast, grind, and brew. Which means “I drink coffee” tells you almost nothing about how much caffeine you’re taking in.
The Real Numbers: How Much Caffeine Is Actually in Your Cup
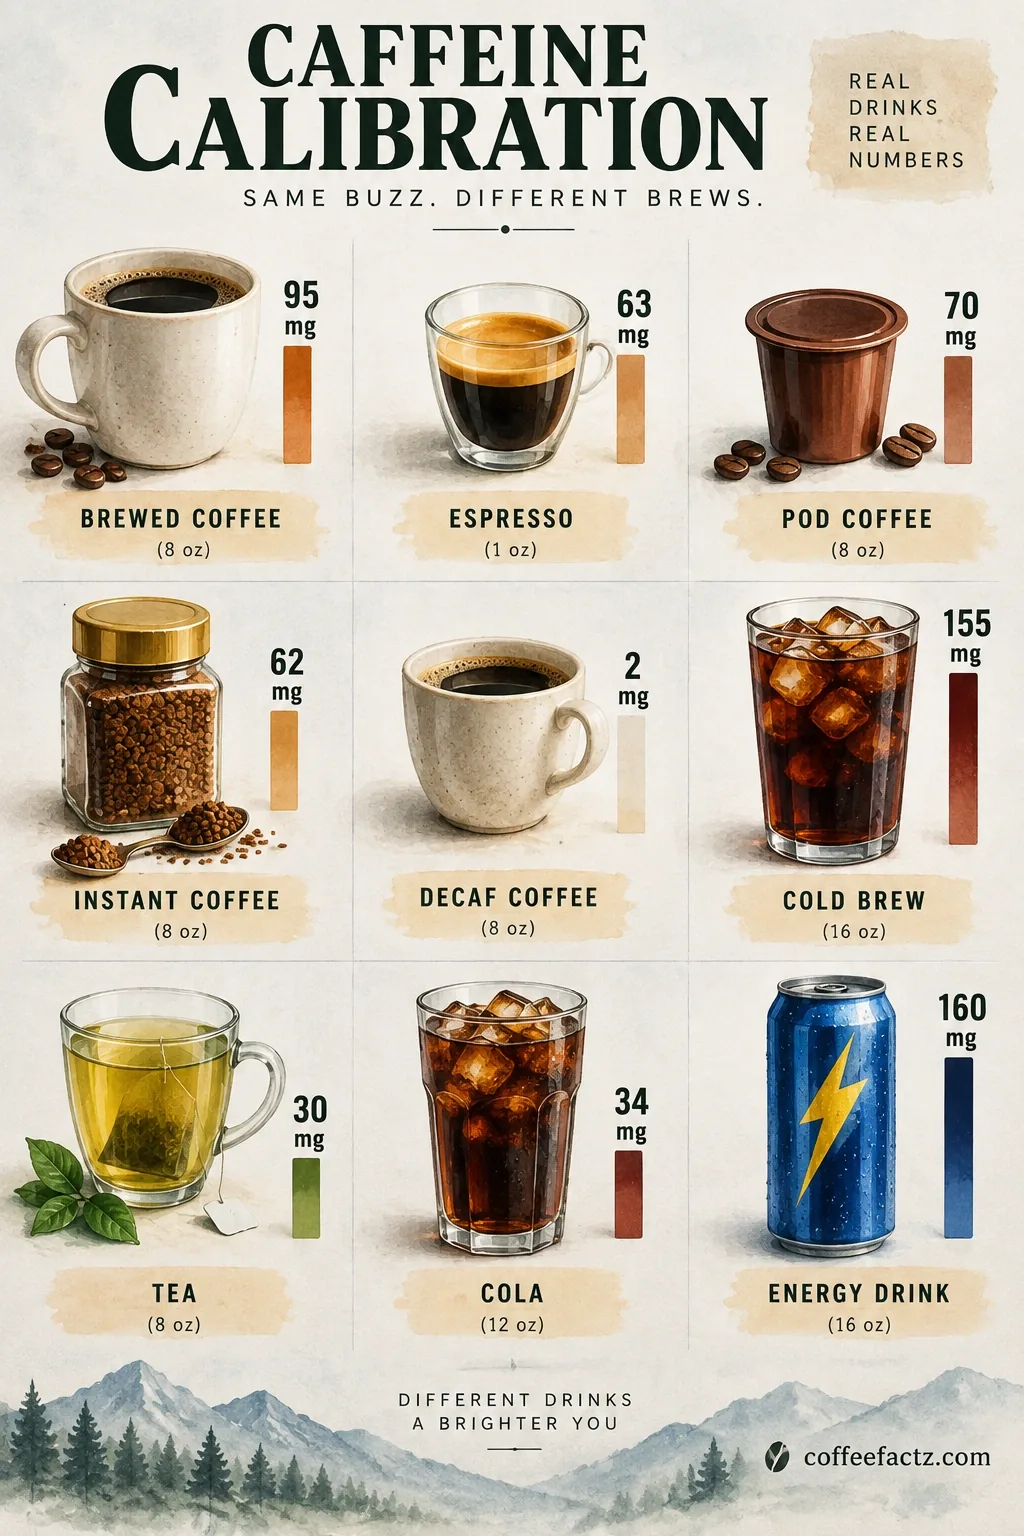
Caffeine content doesn’t belong to a beverage category – it belongs to a preparation. The numbers below are calibration anchors, not fixed values. Every figure has a range because every brew is a different extraction event.
Per-Serving Calibration Table
The table below spans the most common formats. Ranges are shown as ranges. Collapsing them into a single average is how the confusion starts.
| Beverage | Serving Size | Caffeine Range |
|---|---|---|
| Brewed / drip / filter coffee | 8 oz (240 mL) | 95–200 mg |
| Brewed / drip / filter coffee | 12 oz (355 mL) | 107–420 mg |
| Single espresso shot | 1 oz (30 mL) | 47–75 mg |
| Double espresso shot | 2 oz (60 mL) | 94–150 mg |
| Coffee pod / capsule (e.g., K-Cup) | ~8 oz (240 mL) | 75–150 mg |
| Instant coffee | 8 oz (240 mL) | 27–173 mg |
| Decaf coffee | 8 oz (240 mL) | 2–15 mg |
| Cold brew concentrate | 1 oz (30 mL) | 25–50 mg |
| Cold brew (ready-to-drink, diluted) | 8 oz (240 mL) | 100–200 mg |
| Black tea | 8 oz (240 mL) | 14–70 mg |
| Cola beverage | 12 oz (355 mL) | 34–46 mg |
| Energy drink | 8–16 oz | 80–300 mg |
A few things this table makes visible that beverage-type thinking conceals.
Decaf is not caffeine-free. It carries 2–15 mg per cup – low, but not zero. For someone drinking four cups daily, that’s potentially 60 mg from a source they’re counting as nothing.
Espresso is not the high-dose option per serving. A single shot contains less caffeine than a standard 8-oz brewed cup. The confusion comes from concentration: espresso is more caffeine per millilitre, but the serving volume is far smaller. A 12-oz latte built on two espresso shots contains 94–150 mg – often less than the drip coffee it replaced.
Instant coffee has the widest range of any format after brewed coffee. At 27–173 mg per 8-oz cup, it spans a range nearly as wide as filtered coffee. Scoop size, water volume, and product formulation all drive that spread.
The cross-beverage reference points (tea, cola, energy drinks) exist here for calibration only. A comparative analysis of caffeine across coffee, tea, carbonated beverages, and chocolate found that preparation method in coffee and steeping time in tea cause significant differences in caffeine levels – meaning neither “coffee” nor “tea” is a fixed-dose category. The same analysis places a cup of tea, an instant coffee, and a can of cola in a broadly similar band, well below a properly brewed cup of coffee. If you’ve been treating a strong instant coffee as “basically the same as tea,” the numbers say otherwise.
Serving Volume and Daily Total Conversion
Every figure in that table is a per-serving-volume number. The daily guidance you’ll encounter – the 400 mg threshold discussed in detail below – is a total. Those two numbers operate on different scales, and conflating them is the most common arithmetic error health-conscious drinkers make.
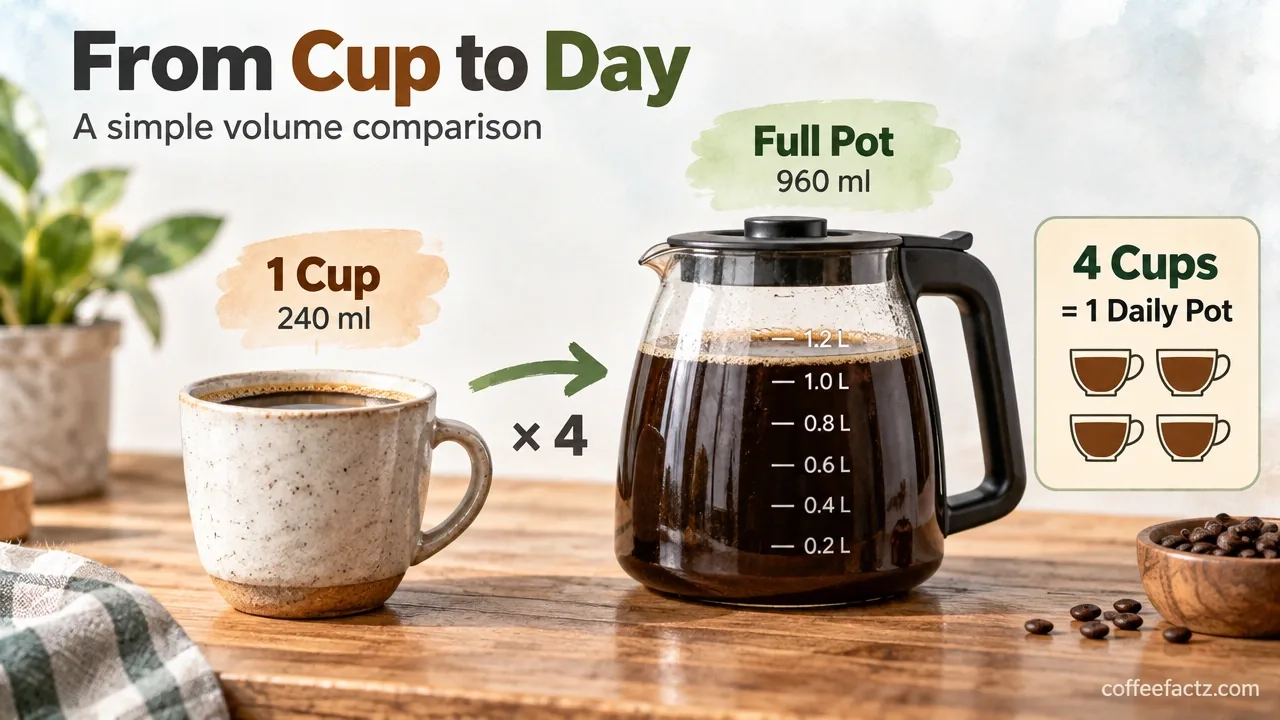
The conversion rule is simple: identify the milligram figure for what you actually drank, confirm the volume you consumed, and add it to everything else you’ve had that day. A 16-oz travel mug of drip coffee isn’t one serving – it’s two 8-oz servings stacked. If each 8-oz carries 150 mg, the mug delivered 300 mg before you reached the office.
“One cup” is a volume claim, not a dose claim. The same coffee at the same strength served in a 16-oz vessel carries exactly twice the caffeine of an 8-oz pour. The bean doesn’t know what size cup you chose.
Preparation method and quantity consumed both determine your actual intake. Caffeine is rapidly absorbed once it reaches the gastrointestinal tract – most enters the bloodstream within 45 minutes. That speed means your daily accumulation builds faster than it feels like it does, which is exactly why per-serving figures need to be tracked against a running total rather than read as isolated data points.
How Caffeine Actually Affects You
Caffeine’s effects on your body are not uniform across people, times of day, or doses. The molecule is the same; the response depends on timing, individual clearance speed, and which physiological system you’re asking about.
Dose Timeline and Physiological Systems
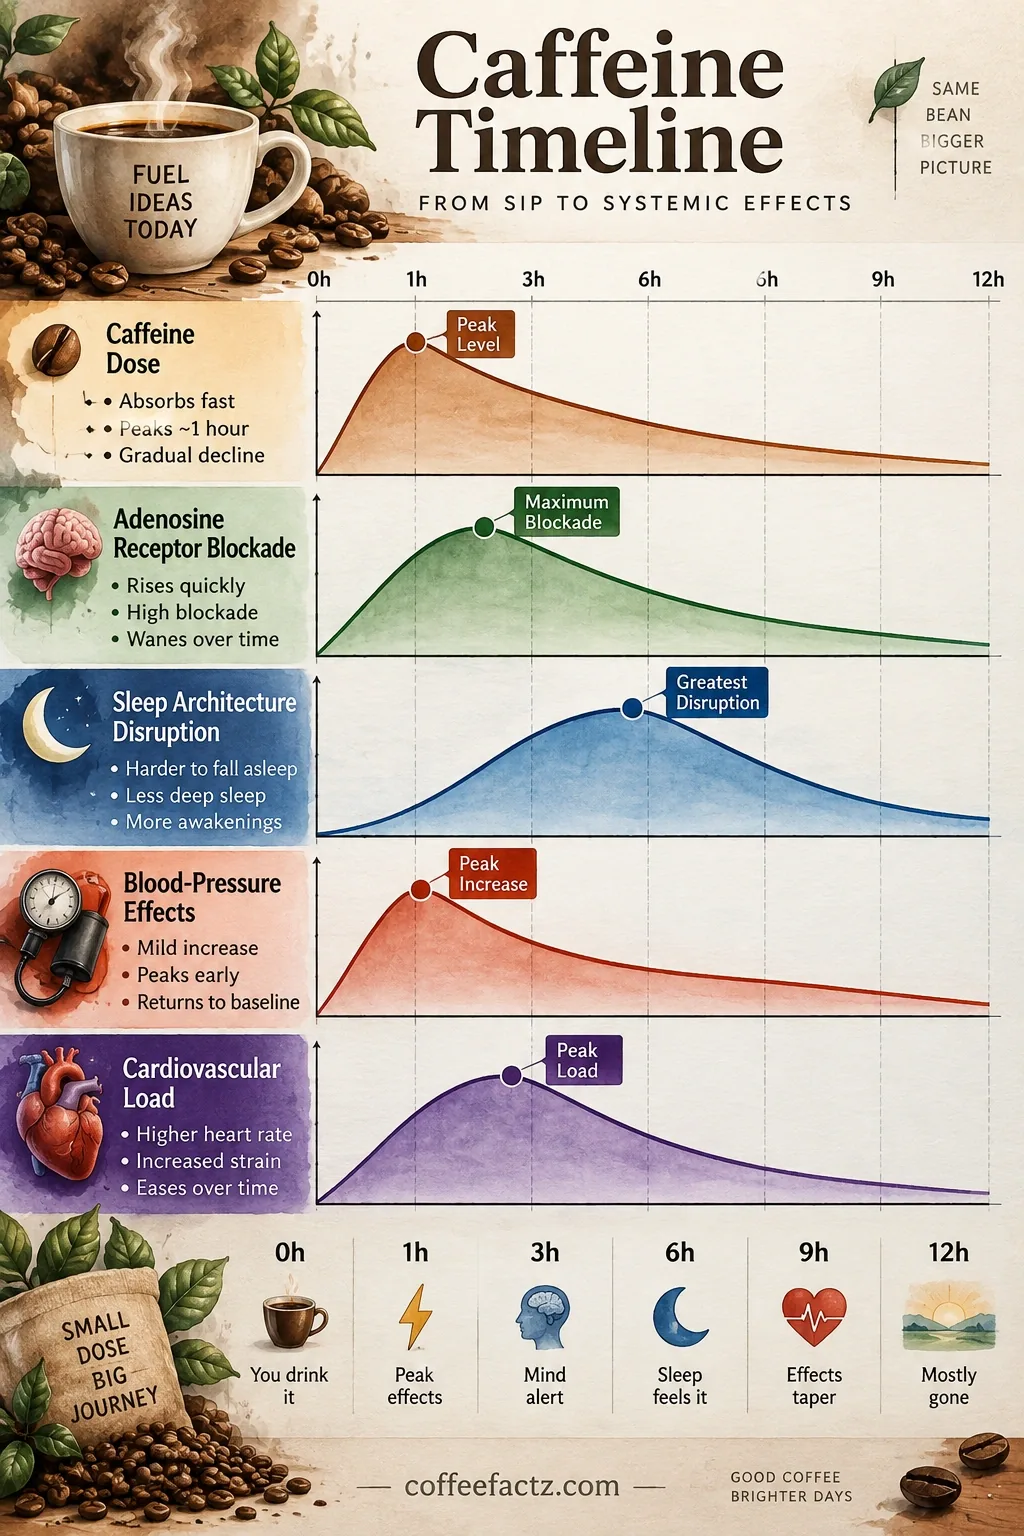
A dose of caffeine follows a predictable arc. Absorption begins in the stomach and small intestine, with peak blood concentration typically reached within 30–60 minutes of consumption. From there, the liver metabolizes it through a cytochrome P450 enzyme pathway, and the half-life – the time for half the caffeine to clear your system – runs roughly 3–7 hours in most healthy adults under normal conditions. That range matters: at the short end, a 2 PM coffee is largely gone by 8 PM; at the long end, it’s still half-present at 9 PM.
The sleep architecture disruption is the most consequential system-level outcome for most readers. Caffeine blocks adenosine receptors during its active window, which delays sleep onset and reduces the proportion of deep sleep (N3/N4) you get even after you fall asleep. It’s not just about whether you can fall asleep – it’s about whether the sleep you get is restorative.
Blood pressure rises acutely after caffeine consumption, typically 3–4 mmHg systolic. For most healthy adults, this is transient and habituated over time with regular intake. For people with existing hypertension or cardiovascular conditions, the picture is more complicated and covered in the limits section below.
Cardiovascular load increases modestly at moderate doses through a combination of elevated heart rate and peripheral vasoconstriction. At high doses – particularly from concentrated or energy-drink formats – these effects become more clinically significant.
Evidence Strength and Sleep Cutoff
The health benefits associated with coffee consumption in observational research – reduced risk of certain metabolic conditions, improved cognitive markers – are largely associative. Most studies show correlation with moderate coffee intake; establishing direct causation is methodologically difficult because coffee drinkers differ systematically from non-drinkers in diet, lifestyle, and socioeconomic factors that are hard to fully control for. The evidence is real and worth knowing. It is not a green light to maximize intake.
The sleep side of the equation is more quantitatively settled.
A systematic review and meta-analysis published in Sleep Medicine Reviews, synthesizing controlled crossover studies, found that caffeine reduced total sleep time by 45 minutes and sleep efficiency by 7%, increased time to fall asleep by 9 minutes, added 12 minutes of wakefulness after sleep onset, increased light sleep (N1) by about 6 minutes, and reduced deep sleep (N3/N4) by 11.4 minutes. The analysis calculated that for a standard 107 mg dose, caffeine needs to be consumed at least 8.8 hours before bedtime to avoid significant reductions in total sleep time.
That 8.8-hour figure is a clearance-timing consequence, not a preference. Caffeine consumed closer to bedtime is still pharmacologically active when your brain needs adenosine receptors free to initiate deep sleep. The 8-hour cutoff rule is the practical rounding of that number. If you go to bed at 11 PM, 3 PM is your last defensible cup – and that’s for a standard-strength dose, not a large commercial serving.
Where the 400 mg Guideline Actually Comes From
The 400 mg/day figure is the most cited number in caffeine safety guidance, and it is almost universally presented without its origin or its population assumptions. That omission matters.
Population Threshold Definition
The consensus is real: up to 400 mg of caffeine per day is considered safe for most healthy adults. This figure appears consistently across major clinical and health-authority sources. What those sources rarely explain in accessible terms is what kind of number it is.
A population threshold is a general-adult ceiling derived from aggregate data. It identifies the intake level at which adverse effects were not observed across a broad, healthy adult population. It is not a personal risk forecast. It does not tell any individual reader that 399 mg is safe for them specifically, or that 401 mg will cause harm. It tells you where the general-population evidence runs out of safety signal.
That distinction determines whether the number is relevant to you. If you are a healthy adult without complicating factors, the 400 mg ceiling is a reasonable outer boundary. If you fall outside that baseline population – pregnant, adolescent, cardiac history, slow metabolizer – the number was not built from data that includes you, and applying it to yourself is a category error.
The derivation gap is worth naming explicitly: across most public-facing health content, 400 mg/day is repeated as expert consensus without specifying what population it describes or what conditions were used to establish it. That omission leaves readers unable to judge when the figure does and does not apply. The next section defines who “most healthy adults” actually means.
Cup Translation and Daily Total
The 400 mg/day figure is commonly translated into “about 3–5 cups of caffeinated black coffee per day.” That translation is arithmetic, and it requires two assumptions: an average caffeine-per-cup figure (often 80–100 mg) and a standard cup volume (usually 8 oz / 240 mL).
Both assumptions are fragile. If your cup is 12 oz and your coffee runs 150 mg per 8 oz, each serving delivers roughly 225 mg – meaning two cups puts you at 450 mg, past the threshold before lunch. The 3–5 cup translation describes a specific, moderate-strength brew in a standard-sized vessel. It does not describe what most people actually drink.
The 400 mg figure is a daily total across all sources – not a per-sitting budget, not a coffee-only allowance. Tea, cola, pre-workout supplements, chocolate, and medications containing caffeine all count toward the same number. Tracking only coffee while ignoring three teas and a pre-workout is a common and significant measurement error.
The 400 mg Limit: Who It Actually Fits
The 400 mg ceiling was built from data on a specific population. Knowing exactly who that population is tells you whether the number applies to you – and whether a single drink can blow past it before you’ve had a second cup.
Baseline Population and Group Ceiling
The baseline population the 400 mg limit describes is: healthy, non-pregnant, non-adolescent adults without cardiac conditions or medications that interact with caffeine metabolism. That’s the group. If you fit that description, 400 mg/day is a reasonable outer boundary based on available evidence.
What it is not: a personal optimum, a target to reach, or a license to consume. Habitual caffeine intake raises your tolerance – the amount you need to feel the same effect increases over time – but tolerance does not change the pharmacological load on your cardiovascular system or your sleep architecture. You can be habituated and still be accumulating physiological cost.
Individual sensitivity varies within that baseline population too. Two people who fit the healthy-adult definition can have meaningfully different responses at the same dose, driven by genetic variation in the CYP1A2 enzyme that metabolizes caffeine. The 400 mg ceiling is a group-level finding, not a personal guarantee.
Outside Populations and Safety Boundaries
Several groups fall outside the baseline entirely, and the 400 mg number does not extend to them. Pregnant people, children and adolescents, people with heart conditions, and slow metabolizers each operate under different ceilings – detailed in the next section – and treating the general-adult threshold as universal for these groups is the most consequential error in most public caffeine guidance.
“Safe” within the threshold means one specific thing: the intake level not associated with harm across a general healthy adult population. It is not a quality endorsement. It is not a recommendation to consume 400 mg daily. It is the upper boundary of where the safety signal holds.
One practical data point that makes the cup-counting problem concrete: a Starbucks Venti brewed coffee is reported at 410–415 mg. A single drink, in a standard commercial size, exceeds the entire daily adult threshold. If you order a Venti and then have an afternoon tea, you are well past 400 mg from two servings that most people would consider moderate consumption. The “average cup” model does not prepare you for that reality.
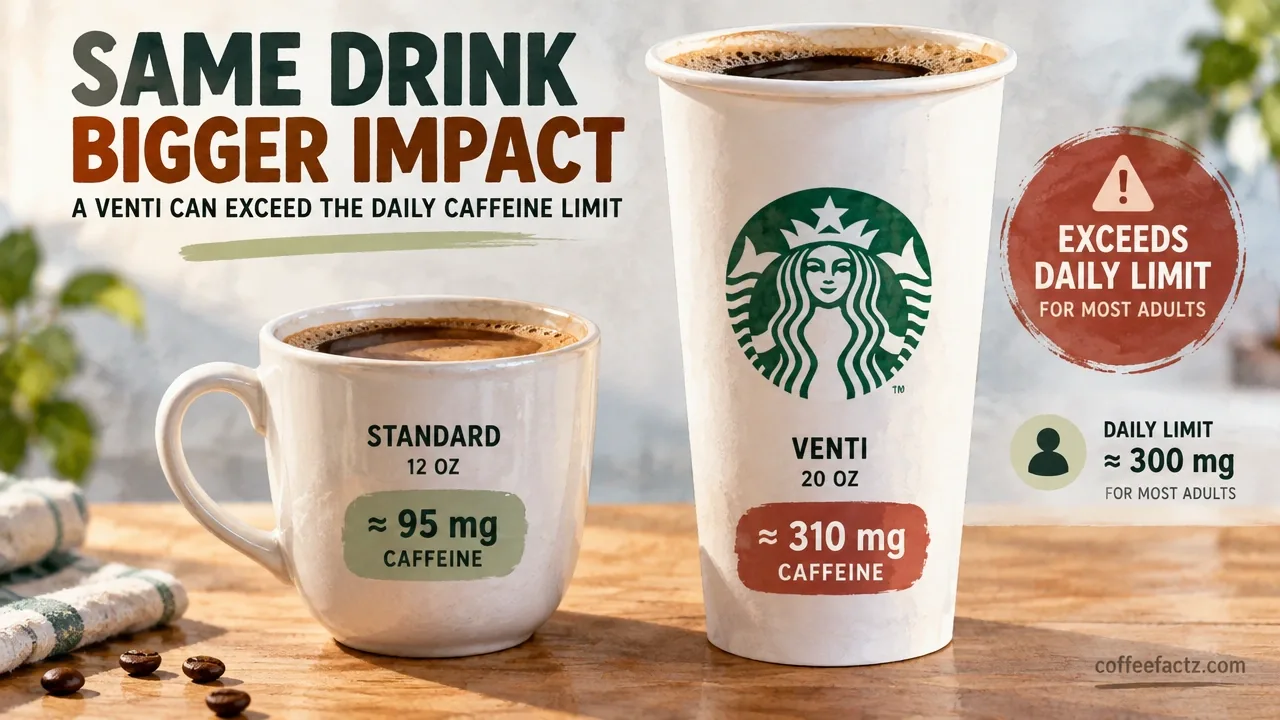
Verify the specific size, brew strength, and preparation of what you actually order – not what category it belongs to. Cup-counting as a safety method fails the moment your cup departs from the assumed average, and in commercial coffee, it departs constantly.
When Caffeine Limits Change Significantly
Your personal caffeine limit is not 400 mg unless you fit the baseline population exactly. For a significant share of readers, the number is lower – sometimes dramatically so – and the mechanism behind each reduction is different.
Pregnancy, Childhood, and Adolescent Ceilings
Pregnancy carries a hard ceiling of 200 mg/day total caffeine from all sources combined – coffee, tea, cola, chocolate, energy drinks, and supplements. Not coffee alone. The total. Most major health authorities align on this figure, and “all sources” is the part most pregnancy guidance undersells.
The mechanism behind the lower number is not simply that pregnant people are more sensitive. It is pharmacokinetic: caffeine’s half-life extends to up to 15 hours in the third trimester, compared to 3–7 hours in a non-pregnant adult. An identical dose lingers in the system more than twice as long. The ceiling drops because clearance slows, not because the molecule changes. A morning coffee that fully clears a non-pregnant adult by early afternoon may still be pharmacologically active at midnight during late pregnancy.
Children and adolescents require age-stratified thinking. There is no established safe level for children under 12, and most authoritative guidance recommends zero caffeine for this group. Adolescents (roughly ages 12–18) are generally referenced at limits ranging from 0 to 100 mg/day depending on body weight and the specific authority cited. The practical implication is clear: caffeine-containing energy drinks and similar high-dose products should be avoided entirely in this group. Energy drinks combine high caffeine doses with other stimulants and are marketed aggressively at adolescents – that combination is the specific risk, not incidental caffeine exposure from tea.
Metabolic, Cardiac, and State-to-Ceiling Lookup
The table below lets you locate your own ceiling in one pass. Find your state; that’s your number.
| Your Situation | Caffeine Ceiling | Notes |
|---|---|---|
| Healthy adult, no complicating factors | Up to 400 mg/day | Total across all sources |
| Pregnant | Up to 200 mg/day | All sources; half-life extends to ~15 hrs in third trimester |
| Adolescent (12–18) | 0–100 mg/day | Weight-dependent; energy drinks should be avoided |
| Child (under 12) | 0 mg | No established safe level |
| Slow metabolizer (CYP1A2 variant) | Markedly below 400 mg | Personal limit may sit well under 400 mg; earlier cutoffs apply |
| Cardiac condition or hypertension | Discuss with physician | Acute BP and heart-rate effects are clinically relevant |
| On interacting medications | Discuss with physician | Several drug classes alter caffeine metabolism significantly |
| Pure / highly concentrated caffeine | Avoid entirely | Dose control is practically impossible; overdose risk is real |
Slow metabolizers carry the same general-adult label but a different pharmacological reality. If caffeine lingers in your system significantly longer than average, your effective daily accumulation from the same number of cups is higher than the standard half-life math suggests. “Your personal limit may sit well under 400 mg” is not a clinical diagnosis – it’s a recognition that clearance speed varies between individuals by a factor of three or more, and that variation changes how the ceiling applies to you.
Cardiac and clinical contexts deserve direct treatment. High-dose caffeine raises heart rate and blood pressure acutely. For people with existing heart conditions, arrhythmias, or uncontrolled hypertension, those acute effects are not trivial. Energy drinks – which combine high caffeine with other stimulants – carry documented cardiovascular risk in this population. Pure caffeine powder and highly concentrated liquid caffeine products should be excluded entirely: the dose is nearly impossible to control accurately, and the margin between a physiologically active dose and a dangerous one is narrow.
No ceiling from this table can be applied without knowing the milligram figure in the cup. That’s the gap this article has been building toward.
The 4 Hidden Factors That Control Caffeine in Your Cup
Caffeine yield in your specific cup is determined by four variables. Not beverage category. Not roast colour. Not how strong it tastes. These four variables – and only these four – explain why two cups of “the same coffee” can deliver doses that differ by 50% or more.
Bean Species and Roast Variables
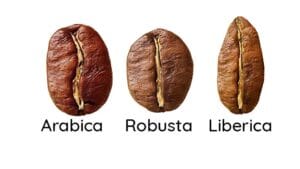
Factor 1: Bean species and cellular density. Robusta beans generally carry roughly twice the caffeine of Arabica by dry weight – a commonly cited ratio that holds across most agricultural analyses. Caffeine is embedded in the bean’s cellular matrix, so the mass of coffee you use and how densely packed that cellular structure is both affect how much caffeine is available to extract. Growing origin and terroir change flavour compounds far more reliably than they change caffeine concentration. Choosing an Ethiopian Yirgacheffe over a Brazilian natural affects your cup’s acidity and fruit notes significantly; it changes the caffeine yield modestly and unpredictably.
Factor 2: Roast level. This is where the most persistent myth lives. Dark roast does not mean more caffeine. It also does not reliably mean less. What roasting does is drive off water and volatile aromatic compounds, which changes the bean’s mass. A dark-roasted bean weighs slightly less than a light-roasted bean from the same origin. If you measure coffee by volume (scoops), you’ll fit more dark-roasted beans into the scoop – which means more caffeine, not because dark roast is stronger, but because the lighter beans are physically larger and pack less densely. If you measure by weight (grams), roast level has minimal effect on caffeine yield. The “dark roast equals more caffeine” belief is a mass-and-density artifact of volumetric dosing, not a caffeine-conversion effect.
Grind, Contact, and Method Mechanics
Factor 3: Grind size and contact time. Grinding increases the surface area of the coffee exposed to water. Finer grind means more surface area, faster extraction, and more caffeine pulled into the cup within a given contact time. Coarser grind means less surface area and slower extraction. Under-extraction – too coarse a grind, too brief a contact time, or water that’s too cool – is the mechanism behind a common sensory confusion: a brew that tastes weak and watery but was made with a high-caffeine bean may still deliver a significant caffeine dose if the ratio of coffee to water was high. Conversely, a brew that tastes intensely bitter and “strong” but was made with a fine Arabica grind at a low dose-to-water ratio may deliver less caffeine than expected. Flavour strength and caffeine level are separate variables. Taste cannot estimate dose.
Factor 4: Method mechanics. Temperature, pressure, and the water-to-coffee ratio set the extraction ceiling. Brew water for most methods should sit between 90–96°C (194–205°F) – below that, caffeine and other compounds under-extract; above it, you extract more bitter compounds without proportionally more caffeine. Espresso uses pressure (typically 9 bar) to force water through a tightly packed, finely ground puck in 25–30 seconds, achieving high concentration in a small volume. Pour-over and French press use gravity and time. Cold brew uses long contact time (12–24 hours) at low temperature to compensate for the absence of heat.
Express dose as grams of coffee per millilitre of water – not scoops, not “strength settings,” not “strong” or “weak.” A 1:15 ratio (1 gram of coffee per 15 mL of water) is a precise, repeatable input. “Two scoops” is not.
For a detailed walkthrough of how grind adjustment changes extraction in a pour-over context, this video covers the mechanics clearly:
Personal Milligram Calculation and Sensory Correction
Here is the calculation you can run right now.
- Identify the milligram figure for your exact product or brew. Use the label if it exists. Use the calibration table in this article as a range reference if it doesn’t.
- Confirm the serving volume you actually consumed – not the default serving size on the package.
- Multiply by servings consumed to get your per-session total. A 16-oz pour from a drip machine is two 8-oz servings.
- Add across the day to get your running total.
- Compare against your personal ceiling from the state-to-ceiling table above – not the generic 400 mg figure, unless you’ve confirmed it applies to you.
The persistent sensory error this calculation corrects: flavour strength and caffeine content are independent. A light-roasted single-origin Arabica brewed at a high dose-to-water ratio can deliver more caffeine than a dark-roasted blend brewed weak. A bitter, intense espresso shot delivers less total caffeine than a mild 12-oz drip coffee. Taste tells you about extraction quality and roast character. It tells you nothing reliable about milligrams.
Beverage-type averages describe a category. Extraction describes a cup. The four levers – species, roast (measured by weight), grind, and method mechanics – are what actually determine what you consumed. When you change your brew method, your coffee, your grind setting, or your cup size, your caffeine figure changes with it. Recalculate. The label you memorized last month may not describe what you’re drinking today.
Frequently Asked Questions About Caffeine Content of Coffee
How many coffees per day is actually safe?
For most healthy, non-pregnant adults without cardiac conditions, up to about 3–4 cups is the practical ceiling – but only if each cup is a standard 8-oz brewed coffee at moderate strength. A single large commercial serving can already exceed the 400 mg daily threshold on its own, so the number of cups matters far less than the milligrams those cups actually contain.
How many mg of caffeine are in a single shot of espresso?
A single shot of espresso typically contains 47–75 mg of caffeine in roughly 1 oz (30 mL) of liquid. That’s less total caffeine than a standard 8-oz brewed cup, even though espresso is far more concentrated per millilitre – the serving volume is simply much smaller.
Does caffeine affect blood pressure?
Yes, acutely. Caffeine raises systolic blood pressure by roughly 3–4 mmHg after consumption. For regular drinkers, this effect is largely habituated over time. For people with hypertension or existing cardiovascular conditions, the acute increase is clinically relevant and worth discussing with a physician before treating the 400 mg guideline as applicable.
Why does the same amount of coffee affect me more than it affects someone else?
Genetic variation in the CYP1A2 enzyme controls how quickly your liver clears caffeine. Slow metabolizers can take significantly longer to process the same dose, meaning caffeine accumulates more across the day and exerts effects later into the evening. The 400 mg population threshold doesn’t account for that individual variation.
Is decaf actually caffeine-free?
No. Decaf coffee typically contains 2–15 mg of caffeine per 8-oz cup. At low consumption levels that’s negligible, but someone drinking four decaf cups daily is consuming up to 60 mg – a meaningful amount for pregnant people or those on strict caffeine limits.
What does “extraction” mean, and why does it change how much caffeine is in my cup?
Extraction is the process of caffeine and other compounds dissolving from the ground coffee into the water. Grind size, contact time, water temperature, and pressure all control how completely that transfer happens. Under-extraction (too coarse, too brief, too cool) leaves caffeine in the grounds; over-extraction pulls more of everything, including caffeine. Two identical coffees brewed differently can yield meaningfully different caffeine doses.
Does cold brew have more caffeine than hot coffee?
Cold brew concentrate is highly caffeinated – it uses a large amount of coffee and long contact time (12–24 hours) to compensate for the absence of heat. Ready-to-drink diluted cold brew typically sits at 100–200 mg per 8 oz, comparable to strong drip coffee. The confusion comes from concentrate versus diluted comparisons; always confirm which form you’re drinking.
Which energy drinks contain the most caffeine?
Energy drinks span a wide range – roughly 80–300 mg per serving depending on the brand and size. Some specialized pre-workout and “extreme” energy drinks exceed 300 mg in a single can. Unlike coffee, energy drinks often combine caffeine with other stimulants, which changes the physiological effect profile beyond what the caffeine number alone captures.
References
- The Pharmacology of Caffeine – The ASAM Principles of Addiction Medicine, 5th Edition | doctorlib.org
- The effect of caffeine on subsequent sleep: A systematic review and meta-analysis | Sleep Medicine Reviews | doi.org