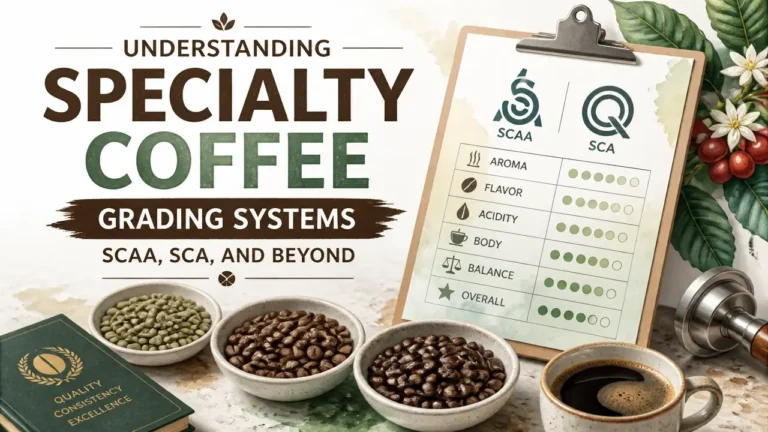

Specialty coffee grading systems do more than assign a number – they run every lot through a two-stage elimination process before a single score gets written down. Most buyers treat the final figure as an absolute truth. It isn’t. It’s a calibrated estimate with documented variation, built on physical inspection standards, a ten-attribute sensory form, and the specific credentials of whoever held the cupping spoon.
Understanding how that number gets constructed changes how you source, how you price, and how you sell. The SCA framework dominates international trade, but Kenya, Brazil, and the Cup of Excellence all speak different grading languages. Reading all of them fluently is the actual professional skill.
Key Takeaways on Specialty Coffee Grading Systems
- A coffee must clear two independent gates – physical inspection and sensory cupping – before earning specialty status; failing either disqualifies the lot regardless of performance on the other.
- Zero primary defects and a maximum of five secondary defects in a 350g sample are the physical thresholds; one full black bean overrides even a 90-point cup score.
- Screen size uniformity predicts roast evenness more reliably than absolute screen size; a consistent 15-screen lot will often outperform an uneven 18-screen lot in the drum.
- The Overall attribute on the SCA cupping form carries disproportionate weight and functions as a grader’s holistic override – two coffees with identical attribute breakdowns can receive different final scores based on Overall alone.
- Inter-grader variation among Q Graders typically runs 2-3 points; a 1-point difference between scores from different labs is statistically indistinguishable from normal variation, not a meaningful quality gap.
- Kenya grades by screen size, Brazil grades by cup cleanliness descriptors, and the Cup of Excellence uses its own multi-panel protocol – treating these systems as equivalent to SCA scores produces sourcing errors.
The Two Gates of Specialty: Physical and Sensory Grading
A coffee earns specialty status by passing two sequential gates, not one. Gate one is physical: green coffee analysis that checks screen size uniformity, defect count, moisture content, and visual color consistency. Gate two is sensory: a blind cupping evaluation by certified Q Graders using the SCA 100-point scale. A coffee that fails gate one never reaches gate two. Both gates are mandatory. Neither substitutes for the other.
The physical gate measures what you can see and weigh. Inspectors work with a 350g green coffee sample and a set of sieves numbered 8 through 20, measured in 64ths of an inch. Screen size uniformity matters here, but not for the reason most buyers assume – more on that in the next section. Moisture content must fall between 10% and 12%; outside that range, the coffee faces accelerated aging, uneven roasting, and unpredictable cup results. Visual color consistency confirms that the lot wasn’t blended from multiple harvests or improperly stored.
The specialty threshold is specific and cumulative. A coffee must score a minimum of 80 points on the SCA cupping scale AND carry zero primary defects with no more than five secondary defects in the 350g sample. Both conditions must hold simultaneously. An 87-point cup with a single full-black bean in the sample is not specialty grade. The defect tolerance is not a sliding scale.
Once a lot clears physical inspection, it moves to the cupping table. There, Q Graders – certified through the Coffee Quality Institute’s rigorous examination program – evaluate ten sensory attributes blind. They score each attribute on a 6.00-10.00 scale. Their individual scores combine into the final cupping score.
One clarification professionals need to internalize early: the final score is a quality baseline, not a flavor descriptor. An 84 tells you the coffee met a calibrated sensory standard. It does not tell you whether the cup tastes of bergamot, brown sugar, or stone fruit. Those descriptors live in the tasting notes section of the form, not in the number itself.
Here’s a visual overview of how both gates connect in sequence:
The infographic below maps the full two-gate process from green sample to final score.

Spencer Turer, Vice President at Coffee Enterprises – a coffee and tea testing consultancy – makes the point plainly: the scores produced by the SCA cupping form exist to define flavor quality only. They are not a measure of processing technique, supply chain integrity, or commercial viability.
The score’s scope is narrower than most buyers treat it. It answers one question cleanly: does this coffee meet a calibrated sensory standard? Every other inference – about price, about origin quality, about producer skill – requires additional information beyond the number.
Brian Warioba, a producer and founder operating in the southern highlands of Tanzania, frames the SCA and CQI evaluation tools as globally acknowledged frameworks for green coffee assessment – while noting that the system still has room to grow.
That tension is real and worth sitting with. The SCA cupping form is the most widely adopted standard in the industry. It is also a living instrument, not a finished one. Professionals who understand its mechanics can also recognize where its edges are.
The Defect Math: How Penalties Shape the Final Score
A single defective bean does not automatically ruin a lot, but the penalty math can absolutely push a specialty-eligible coffee below the 80-point threshold. The defect classification system divides flaws into two categories with different weight, and the conversion from defect count to score penalty is precise.
Primary defects (Category 1) carry full weight. Each instance of a full black bean, full sour bean, pod or cherry, fungus-damaged bean, or foreign matter counts as one complete defect equivalent. These represent the most severe contamination types – beans that introduce fermentation off-notes, mold compounds, or physical contamination into the cup.
Secondary defects (Category 2) carry half weight. Partial black, partial sour, broken or chipped beans, insect damage, shells, and immature or unripe beans each count as one-half defect equivalent. They’re less severe individually, but they accumulate.
The conversion works like this: after counting all defects in the 350g sample, the inspector calculates total full defect equivalents by adding primary counts plus half the secondary counts. That total maps to a penalty on the SCA defect scoring table, which subtracts from the cupping score.
Here’s a concrete example of the financial stakes. A coffee that cups at an 84 sensory score with two secondary defects clears specialty at 84 – the two half-equivalents equal one full equivalent, which falls within the five-secondary-defect tolerance. Change that to three primary defects and the lot is disqualified entirely, regardless of cup quality. A coffee that cups at 82 with zero defects is specialty grade. A coffee that cups at 88 with one full black bean is not. The defect gate is binary.
Specialty-grade defect tolerance:
- Primary defects permitted: 0
- Secondary defects permitted: 5 maximum in a 350g sample
- Any primary defect: automatic disqualification
Now, the vault correction that most grading guides skip. Screen size gets used as a proxy for quality in purchasing conversations all the time – larger beans, higher price. The physical reality is different. Bean size consistency matters more than absolute size for what happens in the roaster. The mechanism is heat transfer: a mixed charge of large and small beans roasts unevenly because smaller beans reach first crack faster than larger ones in the same drum. The result is a muddled cup where some beans are underdeveloped and others are overdeveloped simultaneously. A uniform lot of 15/64-inch beans will often outperform an uneven lot of 18/64-inch beans in the roaster – not because the beans are better individually, but because they behave predictably as a batch.
Roasters who understand this stop paying a blanket premium for large screen sizes and start asking about the uniformity of whatever screen size they’re buying. For cupping for grading verification, this distinction between size and uniformity matters when interpreting why a high-screen lot performs below expectations in the cup.
Inside the Cupping Form: Ten Attributes That Build the Score
The SCA cupping form evaluates ten attributes in a fixed sequence. Q Graders score each on a scale of 6.00 to 10.00, where 6.00 represents “good” and 10.00 represents a perfect expression of that attribute. In practice, professionally graded specialty coffees rarely score below 7.00 on any individual attribute, and a 7.0-7.5 range represents a solid baseline for specialty-eligible quality.
The ten attributes in standard evaluation order:
| # | Attribute | What It Evaluates |
|---|---|---|
| 1 | Fragrance/Aroma | Dry fragrance of ground coffee + wet aroma after hot water addition |
| 2 | Flavor | The central taste impression: sweetness, acidity, bitterness, and complexity together |
| 3 | Aftertaste | Length and quality of flavor that lingers after swallowing |
| 4 | Acidity | Character and quality of perceived acidity – brightness and clarity, not just intensity |
| 5 | Body | Tactile weight and texture of the coffee on the palate |
| 6 | Balance | How well Flavor, Aftertaste, Acidity, and Body complement each other without one dominating |
| 7 | Uniformity | Consistency of flavor across all five cupping bowls in the sample |
| 8 | Clean Cup | Absence of interfering negative impressions from first taste to final aftertaste |
| 9 | Sweetness | Presence of a pleasant, full-bodied sweetness across all five bowls |
| 10 | Overall | The grader’s integrated holistic impression of the coffee’s total sensory profile |
A few attributes need direct clarification for roasters and importers. Acidity does not mean sourness. It refers to the quality and character of the brightness in the cup – a Kenya SL-28 with vivid blackcurrant acidity scores high here because the acidity is distinct and pleasant, not because it’s intense. A coffee with harsh, unpleasant acidity scores low even if that acidity is prominent.
Uniformity and Clean Cup work differently from the other eight attributes. They don’t evaluate a single bowl’s performance. They verify that all five cupping bowls in the sample behave consistently – confirming that the sample is representative of the lot, not an outlier pulled from the bag. A coffee with one bowl that tastes of fermentation while the other four are clean will lose points on both Uniformity and Clean Cup, flagging a lot-level consistency problem.
The total cupping score is the sum of all ten attribute scores. This is where the attribute most commonly omitted in training materials becomes critical.
For a direct demonstration of how Q Graders move through the SCA form in real time, this video walks through an actual cupping session attribute by attribute:
Most professionals can recall eight or nine attributes under pressure. The one frequently dropped is Overall – and it’s the one that carries disproportionate evaluative weight. Multiple training resources list only nine cupping attributes, treating the form as a simple average of discrete scores. The official SCA form uses ten, and the Overall attribute functions as a grader’s integrated override. Two coffees with identical attribute-by-attribute breakdowns can receive different final scores based on their Overall ratings, because Overall captures the grader’s judgment of how the coffee works as a complete sensory experience – something the individual attribute scores don’t fully encode.
This is not a flaw in the system. It’s a deliberate design decision that acknowledges the limits of reductive scoring. A coffee where every attribute scores 7.5 but nothing coheres into a memorable cup deserves a lower Overall than a coffee where Flavor, Acidity, and Aftertaste at 7.5 each combine into something genuinely distinctive. Understanding defect classification in grading alongside sensory scoring gives professionals a complete picture of why some coffees with similar attribute profiles receive meaningfully different final scores.
Why the Same Coffee Scores Differently Across Labs
Subjectivity in coffee grading is documented, measurable, and commercially consequential – yet almost no trade content addresses it directly. The SCA cupping form is standardized. Q Grader certification is rigorous. And the same coffee, evaluated by two different panels, will still produce scores that differ by multiple points. This is not a system failure. It’s the documented behavior of human sensory evaluation.
The calibration process Q Graders undergo is designed to minimize this drift. Recalibration exercises use reference samples to anchor the 6-10 scale at consistent sensory benchmarks – graders periodically evaluate known coffees to confirm their personal scale hasn’t shifted. But calibration reduces variation; it does not eliminate it.
Professional evaluation sessions address residual variation through panel averaging. Typically three to five cuppers evaluate the same coffee independently, and their scores get averaged. This is a statistical correction, not an admission that individual Q Graders are unreliable. It’s the same logic that makes a panel of judges more accurate than a single judge in any sensory evaluation context.
Two distinct phenomena cause scores to drift over time. Score inflation happens when a panel collectively drifts upward – evaluating a given quality level more generously than they would have a year earlier. Reference drift is subtler: the sensory benchmarks themselves shift across competitions or evaluation years as the market’s quality baseline changes. Both affect how you should interpret a score attached to a lot that was graded eighteen months ago versus one graded last week.
A peer-reviewed study in the Journal of Sensory Studies examining adherence and concordance among Q-Graders found that disagreements between tasters significantly affected scores for body, overall, flavor, and acidity – the attributes with the highest sensory complexity – and concluded that this variation carries direct commercial consequences, including the potential for unfair or incompatible product evaluations that affect pricing and market access for producers.
The study’s finding has a practical translation. The typical standard deviation across experienced Q Graders evaluating the same coffee runs 2-3 points. A coffee scored at 84.5 should be read as a probable range of roughly 82-86 when different panels evaluate it under different conditions. A 1-point difference between two scores from different labs is statistically indistinguishable from noise.
This reframes how professionals should use the number. A score’s highest utility is as a comparative tool within a single evaluation event – comparing coffees graded together by the same panel, on the same day, using the same calibration reference. Comparing a score from a competition panel in Portland against a score from an exporter’s internal lab in Ethiopia without knowing the panel size, calibration context, and number of cuppers is comparing two different measurements taken with two different rulers.
Decisions based on score alone – without the evaluating body, the panel size, and the calibration context – are decisions made on noise. The score is real. Its precision is not.
Beyond the SCA: Reading Global Grading Systems
The SCA framework is the most widely adopted international grading system for specialty coffee, but it is not the only commercial language in use. Buyers sourcing from Kenya, Brazil, or Cup of Excellence auction lots are reading three different grading systems that measure different things and communicate different information. Treating them as interchangeable is a sourcing error.
Kenya’s system grades by physical screen size, not cup quality. The designations map directly to bean dimensions:
| Kenya Grade | Screen Size | What It Communicates |
|---|---|---|
| AA | 17/18 (in 64ths of an inch) | Large bean size |
| AB | 15/16 | Medium bean size |
| PB | Peaberry (round single bean) | Bean morphology |
A Kenya AA designation tells you the bean is large. It tells you nothing about cup quality. A Kenya AA can score anywhere from below 80 to above 90 on the SCA scale depending on variety, processing, and farm management. Buyers who pay a Kenya AA premium without a corresponding cupping score are paying for size, not quality.
Brazil’s classification system operates on cup descriptors rather than numeric scores. The top designation, Strictly Soft, indicates the cleanest possible cup – free of any harsh, astringent, or off-flavor notes. The scale descends through Soft, Softish, Hard, Riada, and Rio, each representing increasing levels of cup harshness or defect character. A Brazil Strictly Soft can score anywhere from 80 to 88+ on the SCA scale depending on its other attributes. The descriptor communicates sensory cleanliness; the SCA score communicates total sensory quality. Both pieces of information together tell you more than either one alone.
The Cup of Excellence protocol operates as a separate 100-point system with its own evaluation criteria, multiple rounds of judging by national and international panels, and a minimum qualifying score (typically 87 points). COE scores carry different market weight than an SCA score from a single evaluating body – they represent multi-panel consensus and are directly tied to auction pricing.
Here’s why the distinction matters commercially:
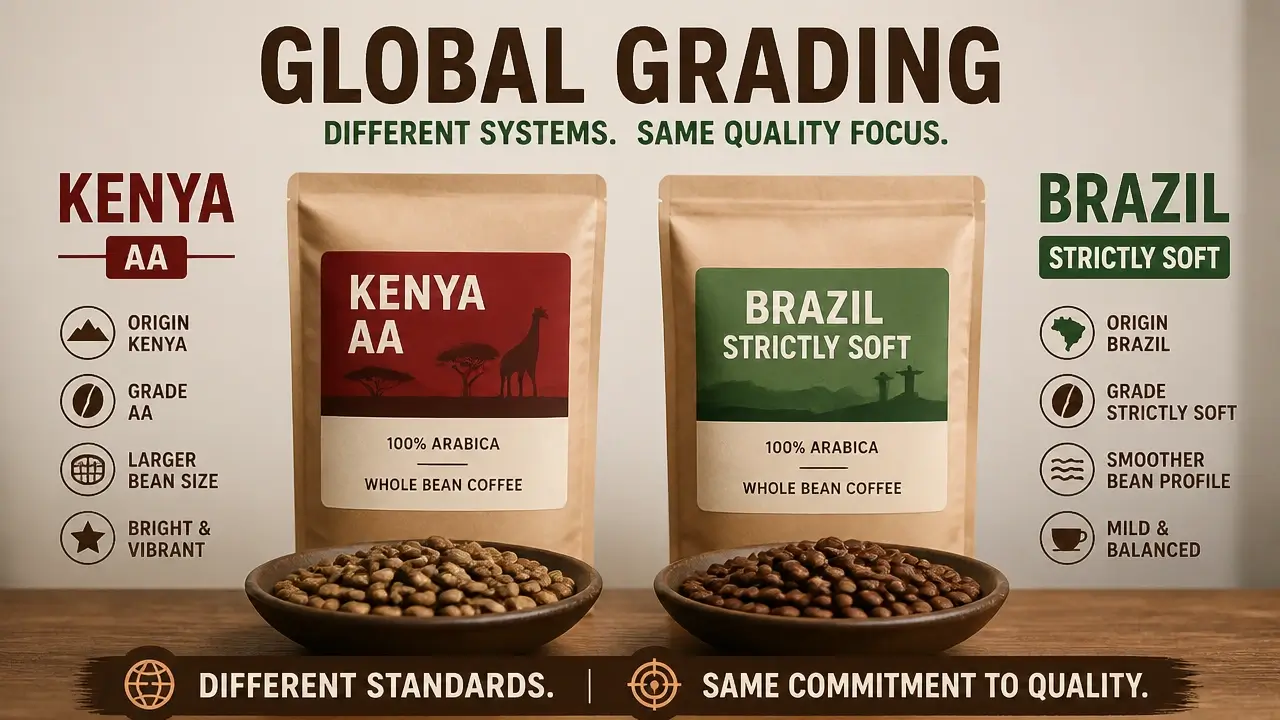
A buyer who reads an SCA 84 as inherently superior to a Brazil Strictly Soft or a Kenya AA is comparing outputs from incompatible frameworks. The SCA score answers “how does this coffee perform on a ten-attribute sensory evaluation?” The Kenya grade answers “how large are these beans?” The Brazil descriptor answers “how clean is this cup?” None of them answers all three questions simultaneously.
Importers and roasters who read all three systems fluently can source more accurately, negotiate more effectively, and avoid the category error of ranking coffees from incompatible grading languages against each other.
From Score to Dollar: The Commercial Logic of Grading
Grading’s pricing impact is not a linear function of the score. The relationship between points and price has three distinct zones, and each zone operates on different market logic.
The 80-84.99 range (SCA designation: Very Good) represents clean, pleasant specialty coffee that clears the minimum threshold. These lots command a baseline specialty premium over commodity prices. The quality improvement within this band is real but modest, and price increases tend to be proportional to the score movement.
The 85-89.99 range (Excellent, complex and memorable) is where the price curve steepens. A coffee scoring 88 is not just marginally better than one scoring 85 – it represents a genuinely distinct sensory experience, and the price delta reflects both quality and scarcity. Fewer lots reach this band, and buyers compete for them.
The 90+ range (Outstanding) operates on auction logic, not quality-premium logic. These lots are rare enough that price is determined by demand at auction rather than by incremental quality differences over 89-point coffees. The Cup of Excellence and similar platforms function as price-discovery mechanisms for this tier.
The credibility of the evaluating body also shapes price. A score from a recognized competition with a multi-panel process carries different market weight than an internal score from a single exporter’s lab. A Q Grader certification on the scoring document signals process integrity, but the identity and track record of the evaluating organization matters for how buyers and importers weight the number in negotiations.
Here’s the practical reality that no score communicates on its own: consumers do not buy numbers. They buy taste experiences and the stories that frame them. A 90-point coffee in generic packaging with no origin narrative will underperform an 84-point coffee with a specific farm name, a documented processing method, a named varietal, and tasting notes written in language a non-specialist can engage with. The score opens the conversation with a professional buyer. The story closes the sale with the end consumer.
For professionals building a product lineup, the score’s commercial value is as a sorting tool, not a final decision. Pair every score with: origin and region, processing method (washed, natural, honey), varietal, harvest year, evaluating body, and descriptive tasting notes. That package is what moves product.
For a deeper look at physical quality assessment during the buying process, return to the complete guide to coffee defects and quality control – it covers the full defect identification framework that sits behind the physical gate described here. The score-tier pricing relationship rewards professionals who understand both the sensory and physical quality dimensions together, not just the number that results from combining them.
Frequently Asked Questions About Specialty Coffee Grading Systems
What happens if a coffee scores above 80 but has one primary defect?
It’s disqualified from specialty grade entirely. The defect threshold and the cupping score are both required – one doesn’t compensate for the other.
How many Q Graders typically evaluate a coffee in a commercial grading session?
Most professional sessions use three to five cuppers whose scores get averaged. This panel structure is a deliberate statistical correction for individual grader variation, not a sign that single-grader evaluations are unreliable.
Can a coffee’s SCA score change after it’s been roasted and packaged?
The SCA score is assigned to green coffee at a specific point in time. Roast development, post-roast resting, and storage conditions all affect the cup – the score doesn’t update to reflect those changes.
Why does a Cup of Excellence score carry more market weight than a standard Q Grader assessment?
COE lots go through multiple rounds of evaluation by both national and international panels, which reduces individual grader bias substantially. The multi-panel consensus behind a COE score makes it a more statistically robust number than a single-lab assessment.
How should I interpret a score that was assigned 18 months ago?
Treat it with caution. Green coffee ages, and the sensory profile that earned a score 18 months ago may not reflect the current cup. Score inflation and reference drift in the evaluating body over that period add further uncertainty.
What does a “Strictly Soft” Brazil classification actually tell me that an SCA score doesn’t?
It tells you specifically about cup cleanliness – the absence of harsh, astringent, or defect-driven flavors. An SCA score aggregates ten attributes into one number and doesn’t isolate cleanliness as a standalone dimension the way Brazil’s system does.
Is there a minimum score required to enter the Cup of Excellence competition?
Yes. Lots must typically score at least 87 points on the COE’s own 100-point protocol to qualify for the international auction round. That threshold is higher than the SCA’s 80-point specialty minimum, which is why COE lots occupy a distinct commercial tier.
Does the SCA cupping form apply equally to all processing methods?
The form is the same regardless of processing method, but graders account for the expected flavor profile of the processing type when assigning scores. A natural-processed coffee with heavy fruit fermentation character gets evaluated on whether that character is clean and intentional, not penalized simply for being present.
References
- Should Specialty Coffee Start at 84 Points? Quality Challenges | perfectdailygrind.com
- Do We Need to Redefine Specialty Coffee? | perfectdailygrind.com
- Adherence and concordance among Q-Graders in the sensory analysis of coffees | doi.org (Journal of Sensory Studies)