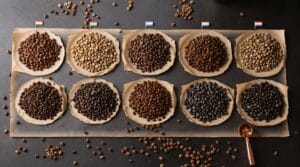

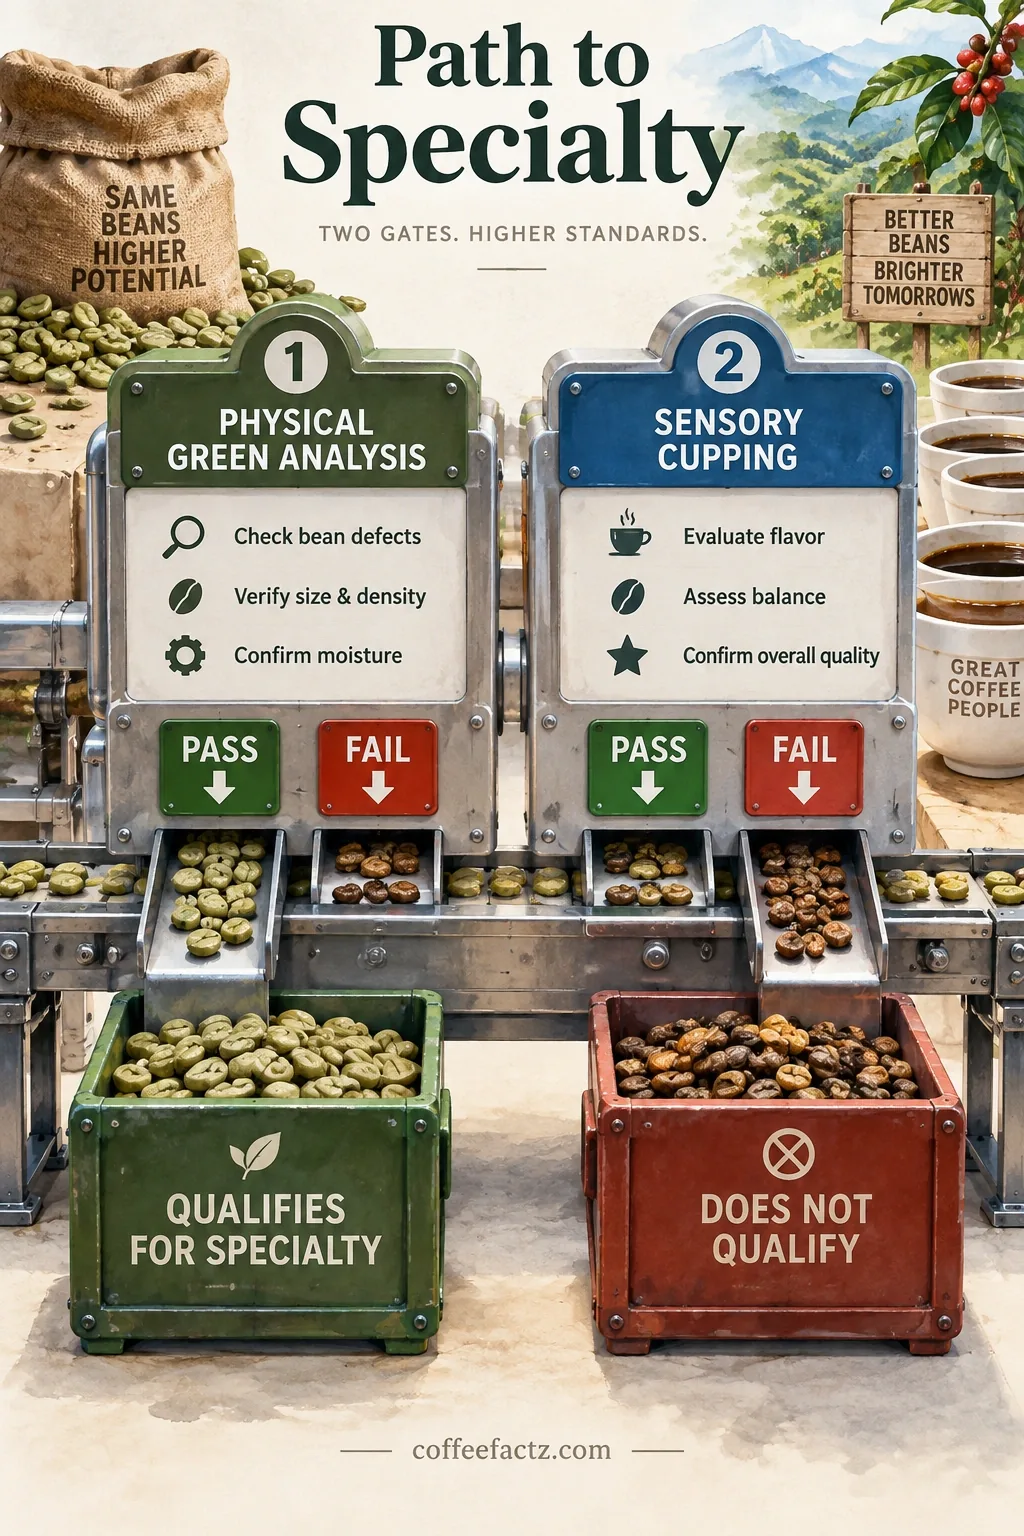
Specialty coffee grading is not a single number on a cupping sheet. It is a two-gate system, and the SCA standards that govern it are stricter and more layered than most trade conversations let on. One lot can cup at 87 and still be disqualified before a grader ever lifts a spoon.
Understanding why that happens – the defect arithmetic, the score sheet anatomy, the moisture specs that nobody grades – is what separates a buyer who reads a supplier’s spec sheet from one who actually controls what lands in the roastery.
Key Takeaways on Specialty Coffee Grading
- Specialty coffee grading is a two-gate system: physical defect analysis and sensory cupping must both be cleared, and neither gate compensates for a failure in the other.
- A single Category 1 defect – full black, full sour, pod, fungus, severe insect damage, or foreign matter – disqualifies a lot regardless of its cupping score.
- Score bands are not uniform across the industry; always confirm which banding table a supplier uses and whether a quoted score is a cup total or a lot average.
- The 100-point total is an opaque aggregation; require attribute-level scores on the sheet, not just the final number, to compare lots and dispute arrivals.
- Moisture content (10–12%) and water activity (<0.70 aw) are the two numbers that determine whether a specialty lot is still specialty on arrival - and both belong in the contract as independent specs with pass/fail thresholds.
- The SCA Coffee Value Assessment organizes evaluation into four parts (Physical, Descriptive, Affective, Extrinsic); most buyer spec sheets cover only two, which means most buyers are working with an incomplete picture of value.
What the SCA Standards Actually Are – and Why Grading Is a Two-Gate System
Specialty coffee grading standards exist to solve a trade vocabulary problem. Without them, a producer in Ethiopia, an importer in Hamburg, a roaster in Portland, and a buyer in Tokyo are each working from a private definition of “quality.” Contracts get disputed. Lots get rejected. Relationships break down over language, not coffee. A documented standard gives every party in that chain the same set of definitions, the same measurement procedures, and the same pass/fail thresholds – so a disagreement about a lot becomes a data conversation, not a credibility argument.
The Specialty Coffee Association maintains the primary reference documents a buyer will encounter in trade: the SCA green coffee grading standard, the cupping protocol and score sheet, and the newer Coffee Value Assessment framework. These are living documents. Standards get revised. Before you cite one on a purchase specification or a contract, confirm the edition and date – because “per SCA standards” without a version reference is not a specification, it is a commercial term without a defined baseline.
Underneath all of it is the SCA Defect Framework—a two-gate system. Physical green analysis runs first. Sensory cupping runs second. A lot must clear both gates to earn specialty status. Neither gate alone is sufficient. A visually clean bag of green coffee is not specialty coffee. A high cupping score on a defect-riddled sample is not specialty coffee. The two gates do not compensate for each other, and the rest of this guide is built on that fact.
This article covers green grading, defect classification, and roastery and warehouse quality assurance. Brewing ratios and espresso extraction standards are outside its scope.
“Current green grading guidelines are based on tradition, rather than on sensory science.” – Peter Giuliano, Head of the Coffee Science Foundation (CSF)
That quality control insight from Giuliano is not a criticism to file away – it is a working instruction. The framework you are about to learn is the best shared language the industry has. It is not a perfect proxy for cup quality, and treating it as one is the most expensive mistake a buyer can make.
The SCA 100-Point Scale: Score Bands, the 80-Point Line, and Where Specialty Really Sits
Published Thresholds and Quality Tiers
The 80-point specialty threshold is the headline number, and it is real: any lot scoring below 80 on the SCA 100-point scale is classified as commercial grade, not specialty, regardless of its origin story or its price tag. Above 80, the scale breaks into working bands that most trade documents reproduce in some version of this form: 80–84.99 is specialty/very good; 85–89.99 is excellent; 90 and above is outstanding.
That last band deserves a plain statement. A 90+ score is an outlier. Most traded specialty lots cluster in the low-to-mid 80s. SCA training material describes the realistic range as 82–88. If a supplier’s catalog is full of 90+ coffees, that is a calibration question, not a portfolio achievement.
The majority of specialty coffees score between 82 and 86, and coffees scoring 90+ are extremely rare and typically produced in limited volumes. – Source: Burnett Coffee
Here is the friction point buyers hit in practice: the published banding is not uniform across the industry. One widely-cited source runs 90–100 Outstanding / 85–89.99 Excellent / 80–84.99 Very Good / below 80 not specialty. Another adds a 65–80 Commodity band and a distinct top tier beyond “outstanding.” SCA training material states most specialty coffees score 82–88. These are not minor discrepancies – they change how you read a supplier’s spec sheet.
Never compare scores across suppliers until you know which banding table they are using. And always confirm whether a quoted “specialty” score is a cup total from a single session or a lot average across multiple cuppings. Those are different claims.
Commercial Classification and Supplier Calibration
What a score actually does commercially is classify a lot. It does not price it. It does not guarantee it holds that classification on arrival. Price is determined by lot specifics – origin, processing method, crop year, availability – and by commercial terms, which the final section of this guide addresses.
Treat a score as the top of a distribution, not a badge. The number on the spec sheet is what the lot cupped at, under specific conditions, on a specific date, by a specific grader. The right follow-up question is not “how high is the score?” It is “what else was on the sheet?”
Importer-level sourcing thresholds add another layer. At least two importers publicly set their own cut-offs at 84+ and 86+. That means “80+ is specialty” and “80+ is buyable from this supplier” are two different numbers, and a specialist buyer’s spec sheet should separate them. Your internal minimum is a sourcing decision. The SCA threshold is a classification definition. Do not conflate them.
The SCA Defect Framework: Category 1 vs. Category 2 and the Zero-Tolerance Rules
Disqualifying and Capped Damage Limits
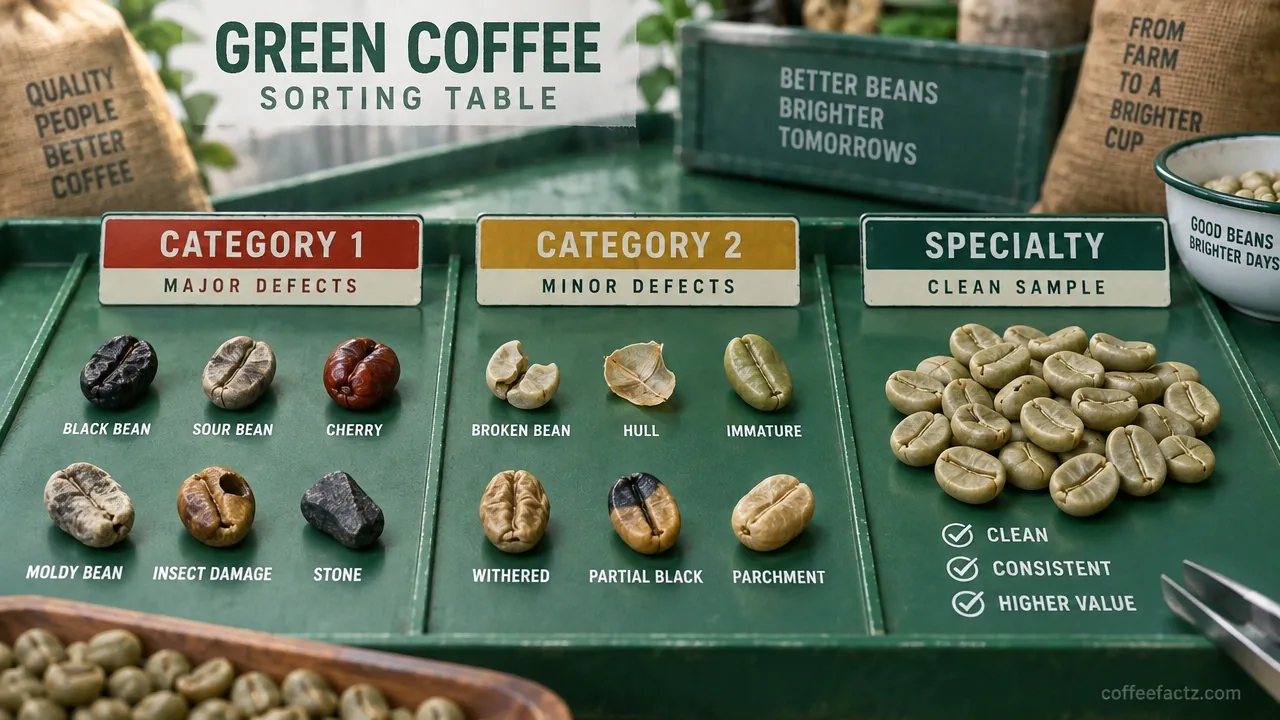
Category 1 defects are the hard stop. The list includes: full black beans, full sour beans, pods or dried cherries, fungus-damaged beans, severe insect damage, and foreign matter. The rule is absolute. Zero Category 1 defects are permitted in a specialty-grade lot. One full black bean in a 350g sample disqualifies the lot, regardless of how it cups. A 91-point coffee with a single pod in the sample is not a specialty lot.
Category 2 defects operate under a cap rather than a zero-tolerance rule. This category covers partial black beans, partial sour beans, slight insect damage, broken, chipped, or cut beans, shells and hulls, and immature or floater beans. Specialty grade permits a maximum of 5 full defects in this category. The word “full” is doing real work in that sentence – it refers to a normalized unit, not a raw bean count, which the next section explains.
One boundary that buyers blur consistently: green bean defects sorted on the grading table are a different system from cup-level deductions applied during sensory cupping. A clean table result does not mean a clean cup. Taints and faults – sourness, mustiness, ferment – are scored separately during cupping, with deductions applied on the score sheet. The current SCA score sheet specifies the applicable deduction values; cite that document rather than relying on figures from older trade guides, since the sheet has been revised.
Weighted Counting Arithmetic
Raw defect counts cannot be compared across lots without conversion. This is the part that trips up even experienced buyers, and it matters because the arithmetic determines whether a lot passes or fails.
The mechanism is an equivalence factor applied per defect type. The formula: Full Defects = Σ (defect count ÷ equivalence factor). To make that concrete: severe insect damage requires 5 beans to equal one full defect; partial black or partial sour requires 3 beans; slight insect damage requires 10 beans.
The practical consequence: ten slightly insect-damaged beans equal one full defect, and five severely damaged beans also equal one full defect. A supplier who quotes “three defects” without publishing the category breakdown and the conversion basis has effectively quoted nothing. The number is unverifiable without the equivalence table. Require category counts and the equivalence table on every spec sheet – not as a formality, but because without them, a “three defect” result from one supplier and a “three defect” result from another may describe entirely different physical realities.
The Physical Grading Protocol: Sample Mass, Screen Size, and How Full Defects Are Counted
Green Table Sorting Procedure
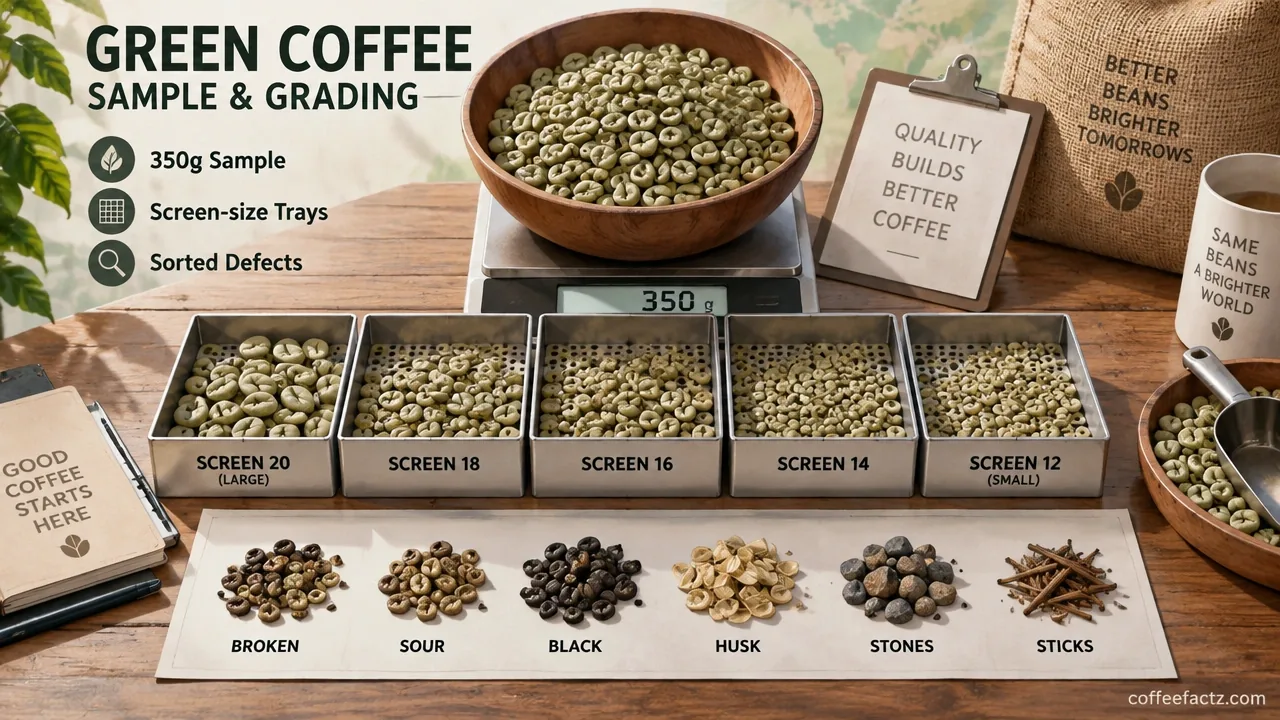
Green table sorting starts with a working sample of 350g – drawn from the lot, spread on a clean flat surface, and hand-sorted by a trained grader. Defects are separated by category as the sort proceeds, then counted and converted to full-defect equivalents using the equivalence factors above. The result is checked against the Category 1 zero-tolerance rule and the Category 2 maximum of 5 full defects.
Screen size and bean size distribution belong on the same physical report as defect counts. Uneven size distribution is not a cosmetic issue. Beans of significantly different sizes roast at different rates, which means a lot with high size variance creates a production problem before it creates a flavor problem. A buyer who ignores screen data is accepting roast inconsistency as a hidden variable in their QC.
Quakers – underdeveloped beans that remain pale after roasting – are not permitted in specialty grade. They are the clearest illustration in the grading system that physical sorting and sensory outcome are connected, not separate exercises. A quaker passes the raw green sort invisibly, reveals itself only after roasting, and degrades the cup. Their exclusion from specialty grade is the standard acknowledging that the table and the cupping room are one system.
Transactional Draw Discipline and Basis Standardization
The 350g figure is the number most trade guides print, and it is the single most inconsistent number in the published literature on green grading. One leading green grading guide specifies 350g. Two widely-read roaster resources specify 300g. SCA training material describes samples of 100g–300g. Because defect limits are expressed per sample mass, a result of “5 full defects” is a different claim at 350g than it is at 300g. The number changes. The pass/fail outcome can change with it.
Across a transaction, three sample draws matter: the offer sample, the pre-shipment sample (PSS), and the arrival sample. Representativeness of the draw matters more than sample size – a documented draw method is what makes a result repeatable and defensible. A grab sample from the top of a bag is not a documented draw method.
Documentation rule: sample mass, equipment, standard edition, and grader name must appear next to every defect result. A defect count without a stated mass basis is unusable for comparison. Fix your own house mass – 300g or 350g, your choice – in your purchase specification, and hold it constant. Your historical data is only comparable year over year if the basis stays the same.
Inside the Score Sheet: Cupping Constants, Ten Attributes, and the Q Grader’s Role
Extraction Ratios and Palate Dimension Assessment
The number in “this lot scored 86” comes from a controlled sensory protocol, not a general impression. The cupping constants that define a grading cupping are: 8.25g of coffee per 150ml of water, water at 93°C / 200°F, a 4-minute steep, crust broken at 4 minutes, and evaluation as the cup cools toward approximately 71°C. Deviate from those parameters and the result is not a grading cupping – it is an opinion. A score produced under different conditions cannot be compared to one produced under the standard.
The Q Grader scores ten sensory attributes across the evaluation: fragrance/aroma, flavor, aftertaste, acidity, body, balance, uniformity, clean cup, sweetness, and overall. Each attribute receives its own score. The grader also applies a separate cup-level deduction step for taints and faults – the same system referenced in the defect section – which reduces the total before the final score is recorded.
For a practical look at how a certified Q Grader runs this protocol from setup through scoring, this walkthrough is worth the time:
Blind Evaluation Discipline and Licensed Assessor Currency
A single cupping session is a data point. A grade is a replicated result. The blind-protocol discipline that separates the two: samples are coded before the session, graders do not discuss scores during evaluation, cuppings run in multiples, and graders calibrate against known references. Remove any of those conditions and you are back to an opinion.
The Q Grader designation is licensed and periodically recalibrated through the Coffee Quality Institute. A score is only as credible as the grader’s calibration currency – an expired certification is a meaningful caveat, not a technicality. Record who cupped the lot and when. That information belongs on the spec sheet, not in an email thread.
Document Anatomy and Aggregation Opacity
The score sheet has a visible structure: attribute rows, subtotals, deductions, and a final score. Most buyers receive the final number. That is the wrong document.
The literature that describes this protocol – across every reference reviewed for this guide – explains the attribute list in detail but never explains how the ten attribute scores are weighted or aggregated into the final 100-point total. That aggregation is opaque. Treat any single total as an opaque summary of a process you cannot reverse-engineer from the number alone.
The practical consequence: require attribute-level scores, not just the total. Two lots at 86 with different acidity, body, and uniformity profiles are different products for a roaster. A lot with high acidity and low body behaves differently in a blend than one with the inverse profile – even if the final number is identical. Attribute detail is also your only leverage when disputing a score at arrival. A total of 86 gives you nothing to argue with. An attribute sheet gives you a specific row.
Beyond a Single Score: The SCA Coffee Value Assessment
The SCA’s evaluation model has moved beyond a single cupping score. The Coffee Value Assessment (CVA) organizes coffee evaluation into four complementary parts: Physical, Descriptive, Affective, and Extrinsic.
Physical assessment covers the green bean analysis and defect framework described in this guide – and it is built on the 2004 SCA green coffee grading system. That framing matters: the defect categories and counting arithmetic in H2-3 and H2-4 are not legacy material to be superseded. They are the foundation the newer model still stands on.
Descriptive assessment is the objective sensory profile – what is present in the cup, characterized without a quality judgment. Affective assessment is the hedonic layer – the quality judgment, the score. Extrinsic assessment covers attributes outside the cup itself: traceability, certification, sustainability credentials, producer story. For contract citation, the standard references are SCA Standard 103 for Descriptive, SCA Standard 104 for Affective, and SCA Standard 105 for Extrinsic. Cite these by number in contracts so a spec sheet cannot be reinterpreted after the fact.
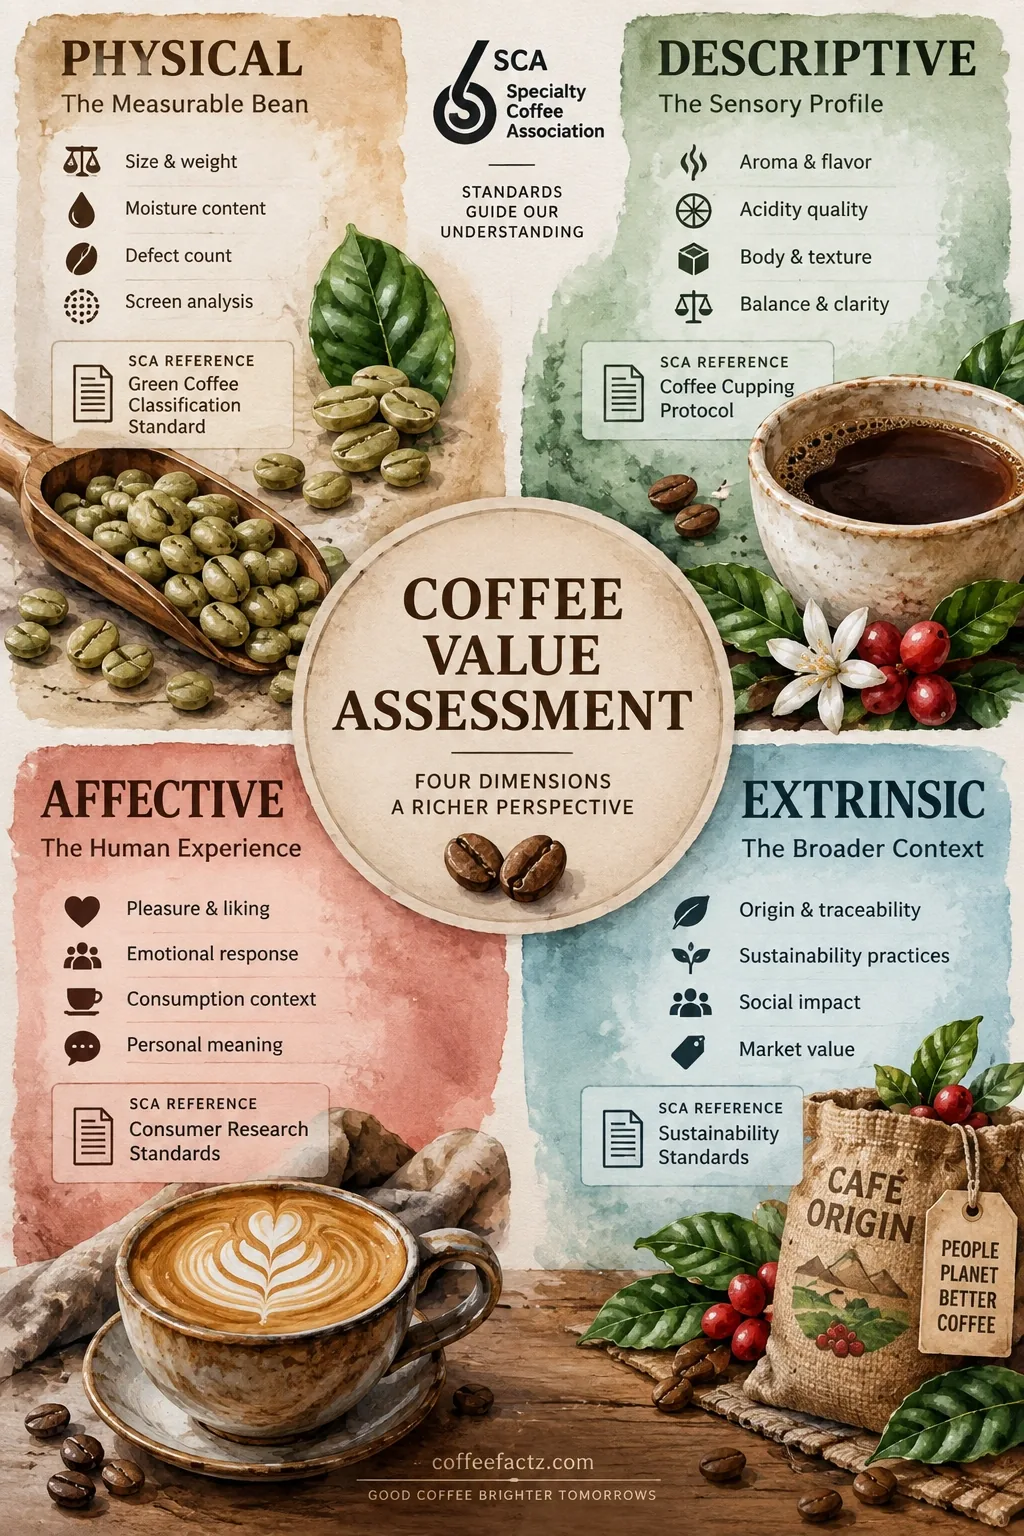
The commercial reading is direct: the more assessment types completed, the more complete the picture of a lot’s value. Two lots with the same cup score can carry very different prices because one has a documented extrinsic profile – a certified origin, a named producer, a verifiable processing method – and the other does not. The CVA exists precisely because a single score under-describes value. A lot can be physically flawless, sensorially modest, and still be commercially distinct on extrinsic terms.
Most buyer spec sheets today cover Physical and one sensory number. That is not a value assessment. It is a minimum classification check. Map your spec sheet to all four parts, even if you only complete two of them consistently – the exercise of naming what you are not assessing is itself useful.
Moisture Content and Water Activity: The Stability Specs Nobody Grades
Green Coffee Hydration and Microbial Limits
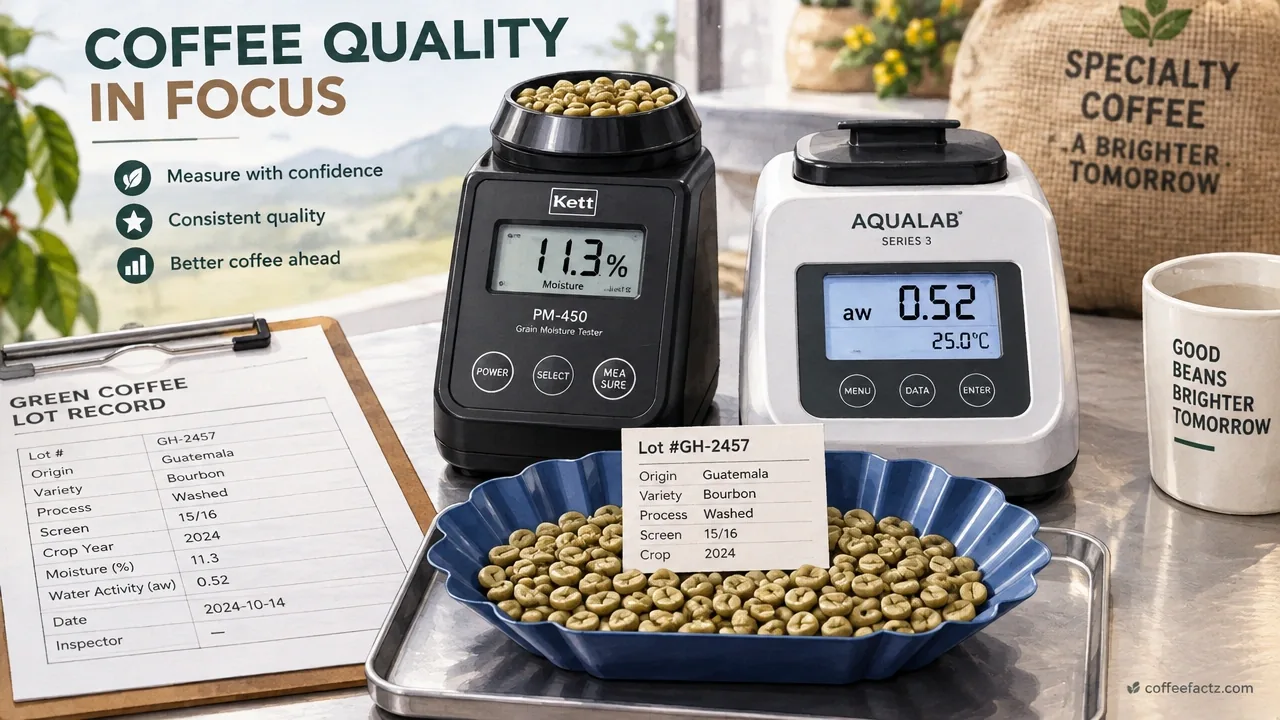
Moisture content in green coffee has an accepted working band of 10–12%. The number measures total water in the bean. Both sides of that band carry real risk.
Above 12%, you are looking at conditions that support mould growth, accelerate flavor degradation, and produce uneven roast development – water in the bean is absorbing heat that should be driving the roast. Below 10%, the bean becomes brittle, generates more physical breakage during handling, and the cup starts to flatten. The buyer also absorbs a weight loss that does not show up in the FOB price but shows up in the yield.
Water activity – the <0.70 aw ceiling - is a more precise stability predictor than moisture percentage alone. Moisture content measures total water. Water activity measures the free water available for microbial metabolism. A bean can sit within the 10–12% moisture band and still carry enough free water to support fungal growth if the aw is elevated. For long-transit shipments or warm, humid storage conditions, tighten that ceiling toward <0.65 aw.
Across every reference source reviewed for this article, there is no meaningful coverage of moisture content ranges or water activity limits for green coffee – and none on the operational verification that would catch a failure before it becomes a loss. The grading conversation in trade literature stops at the cupping table. The stability conversation starts after the container is sealed.
Chain-Wide Preservation and Contract Controls
A cupping score is earned at origin, under origin conditions, before the shipment moves. Nothing in that score captures what happens to the lot over six weeks in a container. A lot that cups at 86 at origin can land at 80 after a bad container – high humidity, temperature swings, inadequate packaging barrier. That is not a supplier fraud problem. It is a specification gap.
A study published in the Journal of Food Processing and Preservation examined dry cherries and green coffee beans stored for 60 days at 35°C across a range of water activity levels. Aspergillus, Rhizopus, and Penicillium were all isolated from the samples, and the highest ochratoxin A concentrations – between 15.49 and 65.22 μg/kg – occurred at aw levels between 0.515 and 0.821, alongside the most severe physical deterioration. The data establish aw as the governing variable for both microbial stability and physical quality degradation during storage.
That finding has a direct operational implication. Ochratoxin A contamination at those concentrations is not a sensory event you will catch on a cupping table. It is a food safety failure that develops silently during transit and storage. The <0.70 aw ceiling is not a quality-assurance preference - it is a contamination control threshold.
Evaluate a lot across the full chain: terroir, processing, milling, grading, packaging, shipping, and storage. Quality is a chain property. The practical levers you can write into a contract before the container ships: packaging barrier specification, container protection requirements, and climate-controlled storage terms. State these as handling requirements with measurable standards, not as general expectations. A supplier who agrees to “appropriate packaging” has agreed to nothing.
Make moisture content and water activity independent contractual specs with their own meter readings and pass/fail thresholds, documented per lot ID. They belong on the same spec sheet as the defect count and the cupping score, with the same consequence for failure.
Roastery and Warehouse Quality Control: Turning Standards Into an Intake Decision
Calibration Tooling and Sample Roast Protocol
Intake QC starts with two meters: a calibrated moisture meter and a calibrated water activity meter, applied to every arrival sample. Not certificates of analysis alone. Certificates describe a lot at a point in time, under conditions you did not observe. Meter readings at intake describe the lot as it arrived, under your roof, on your equipment.
Record every reading per lot ID with calibration logs attached. A number you cannot defend a year later is not quality data – it is a note. Calibration logs are what convert a reading into evidence when a dispute arises.
Sample roasting for QC requires small-batch, repeatable sample roasters running fixed profiles. The profile must be defined before anyone cups. An uncontrolled sample roast is a confounding variable: if the roast changes between the offer sample evaluation and the arrival sample evaluation, you cannot tell whether the cup changed because the lot changed or because the roast changed. Fix the profile. Hold it constant. Then the sensory data is comparable across lots and sessions.
Batch Consistency and Lot Traceability
Batch consistency in production is a loop, not a checkpoint. Roast profiling establishes the target. Batch-to-batch cupping catches drift. Retention and archive samples provide the reference point when a customer flags a quality issue two weeks after the bag left the roastery. A defined rest period before evaluation closes the loop – coffee cupped too soon after roasting gives you degassing noise, not cup character.
The loop exists to catch the gap between the approved sample and the working stock before it reaches a customer. By the time a customer reports an off-flavor, the correction window has closed. Batch cupping catches it while there is still inventory to hold.
Lot traceability on the spec sheet means: lot ID, standard edition, grading method, sample mass, and grader name, all attached to the result. A spec sheet that describes a brand’s general sourcing philosophy is a marketing document. A spec sheet that describes a specific lot, graded on a specific date, by a named grader, against a cited standard edition, is a quality record.
Commercial Terms and Arrival Remedies
The buying workflow has a logical sequence that most buyers compress at their own cost. Set a non-negotiable minimum SCA score and a maximum landed cost before the conversation starts. Request offer and pre-shipment samples before commitment – the PSS is the last point at which you can reject a lot without absorbing shipping cost.
Calculate true landed cost before approving: FOB price plus freight, insurance, port fees, customs duties, and warehousing. A lot that looks attractive at FOB can look very different at landed cost, and a roaster who prices on FOB is systematically underestimating their cost of goods.
Write explicit arrival remedies into the contract before the container ships: the conditions that trigger a claim, the measurement method, the resolution timeline, and the remedy – price adjustment, replacement lot, or rejection. “We will discuss it when the lot arrives” is not a remedy. It is a negotiation you will have from a position of weakness, with a container of coffee you have already paid for.
The final selection rule is not either/or. Physical grading is necessary but not sufficient for specialty grade. A lot can pass the physical gate cleanly – zero Category 1 defects, no more than 5 full Category 2 defects – and still cup below 80, making it commercial despite a clean table. The reverse asymmetry is absolute: a single Category 1 defect disqualifies a lot even if it cups at 90. The two gates do not compensate for each other.
And neither gate compensates for a stability failure. A lot that passes physical and cups at 86 but arrives with moisture at 14% and aw at 0.80 is not the lot you approved.
Approve only when all three conditions are documented on one lot ID: physical pass, cup score at or above your minimum with attribute-level detail, and moisture/aw inside your contracted thresholds – with a named remedy if an arrival sample fails any one of them. Single-metric approval is the most common and most expensive buying error in specialty green purchasing.
Frequently Asked Questions About Specialty Coffee Grading
Can a lot pass physical grading and still fail to qualify as specialty?
Yes. A lot can have zero Category 1 defects and fewer than 5 full Category 2 defects and still cup below 80, which puts it in commercial grade. Physical cleanliness is the first gate, not the final verdict.
What happens if a supplier uses a different sample mass than the one on my spec sheet?
The defect count becomes incomparable. Because defect limits are expressed per sample mass, a result of “5 full defects” at 300g describes a different physical reality than the same number at 350g. Always state your house mass in the purchase spec and require suppliers to convert to that basis.
How often should a Q Grader’s certification be verified before accepting a cupping result?
Every time a score is cited in a contract or purchase decision. Q Grader certification requires periodic recalibration through the Coffee Quality Institute. An expired certification is a material caveat – record the grader’s name and certification status alongside every score on file.
Is water activity more important than moisture content for green coffee storage?
For microbial stability, yes. Moisture content measures total water; water activity measures free water available for fungal and bacterial metabolism. A bean can sit within the 10–12% moisture band and still carry enough free water to support mould growth if aw is elevated. Use both measurements, but treat aw as the governing variable for contamination risk.
What does the Extrinsic dimension of the Coffee Value Assessment actually cover?
Attributes outside the cup itself: traceability documentation, certifications (organic, fair trade, Rainforest Alliance), sustainability credentials, and producer identity. These are the factors that allow two lots with identical cupping scores to carry different commercial values in the market.
Why do some importers set sourcing floors at 84 or 86 when the SCA specialty threshold is 80?
Because the SCA threshold defines the classification minimum, not a sourcing standard. Importers apply their own floors based on their customer base, quality positioning, and commercial risk tolerance. Know the difference between the classification floor and your supplier’s floor before reading their spec sheets.
How do I handle a dispute if an arrival sample scores below the contracted minimum?
You need three things in place before the container ships: a defined measurement method (which grader, which protocol, which sample mass), a specific score threshold written into the contract, and an explicit remedy – price adjustment, replacement, or rejection with a timeline. Without all three, you are negotiating from a position of weakness with coffee you have already paid for.
What is the difference between a taint and a fault on the SCA score sheet?
Both are cup-level defects applied as deductions during sensory evaluation, but they differ in intensity. A taint is a negative flavor that does not dominate the cup – it reduces the score but does not necessarily disqualify it. A fault is more severe and typically results in a larger deduction. Both are separate from the green table defect categories and are scored on the cupping sheet, not during physical sorting.
References
- Grounding Green Grading | sca.coffee
- What an 88–93 Coffee Score Actually Means | burnettcoffee.com
- Influence of water activity on physical properties, fungal growth, and ochratoxin A production in dry cherries and green-coffee beans | exa.ai