


The world’s top coffee exporting countries don’t agree on their own rankings, and that’s not a data problem. It’s a methodology problem. Export volume, export value, production tonnage, and re-export revenue each produce a different Top 10, with different countries at #4 through #10 and a completely different set of “exporters” when value is the lens.
This ranking uses one lens: origin-country export volume in 60-kg bags. Brazil, Vietnam, and Colombia hold the top three slots by wide consensus. Everything below that is contested, cyclical, and worth understanding at the mechanical level before you trust any list you find.
Key Takeaways on Coffee Exporting Countries
- Brazil holds #1 under every ranking lens simultaneously; no other origin can make that claim.
- Vietnam’s 25-30 million bags of Robusta anchor global instant and espresso-blend supply, making a short Vietnamese crop a pricing event for commercial roasters worldwide.
- Colombia’s dual harvest system (main crop plus Mitaca) is the structural reason it can supply fresh-crop washed Arabica year-round when other origins cannot.
- Indonesia’s export volume (6-8M bags) runs significantly below its production (10.9-12.9M bags), which is why it appears in different positions across production-ranked versus export-ranked lists.
- EUDR compliance costs fall disproportionately on smallholder cooperatives, with research from the Colombian context estimating $105,000-$215,000 per cooperative of 500 farmers.
- Everything from #4 to #10 is contested; the only defensible consensus positions are Brazil at #1, Vietnam at #2, and Colombia at #3.
How This Ranking Works: Four Lenses, One Unit Standard
“Top coffee exporter” is not one ranking. It’s four, and each one answers a different question. Before looking at any specific origin, you need to know which question this list is answering, because the lens you choose changes who appears in the table and where.
The Ranking Lens: Export Volume, Not Value or Production
This ranking covers origin-producing countries ordered by export volume, stated in 60-kg bags and cross-referenced in metric tons. The reference period is the most recent complete crop year available at time of publication. It does not rank by export value, and it does not rank by production tonnage.
The unit reconciliation a trader needs is straightforward: one 60-kg bag equals 60 kilograms, or 0.06 metric tons. To convert bags to metric tons, multiply by 0.06. To go the other direction, divide metric tons by 0.06. A shipment of 1 million bags is 60,000 metric tons. Keep that ratio in your head and you can sanity-check any figure you encounter against any other source.
The professional reference for contract standards, technical specifications, and sustainability definitions is the ITC Coffee Guide, published by the International Trade Centre. That document handles the contractual mechanics. This article handles the export-volume economics.
One scope boundary worth stating plainly: Fair Trade, Rainforest Alliance, and other certification standards are excluded here. They are legitimate and consequential, but they belong in a dedicated certification guide. Mixing certification economics into a volume ranking is exactly what makes most competitor lists unreadable. The ITC Coffee Guide is the right place to start on that side of the trade.
The biggest credibility risk in this topic isn’t bad data. It’s unit confusion. One widely-cited source lists 178 million kilograms of production alongside 8.11 million tons of export quantity in the same table, two figures on incompatible scales presented as if they’re comparable. When you see that kind of mismatch, the source hasn’t made a factual error. It has failed to reconcile its own units. That’s the first thing to check before trusting any ranking.
Species Composition, Destination Demand, and the Hub Effect
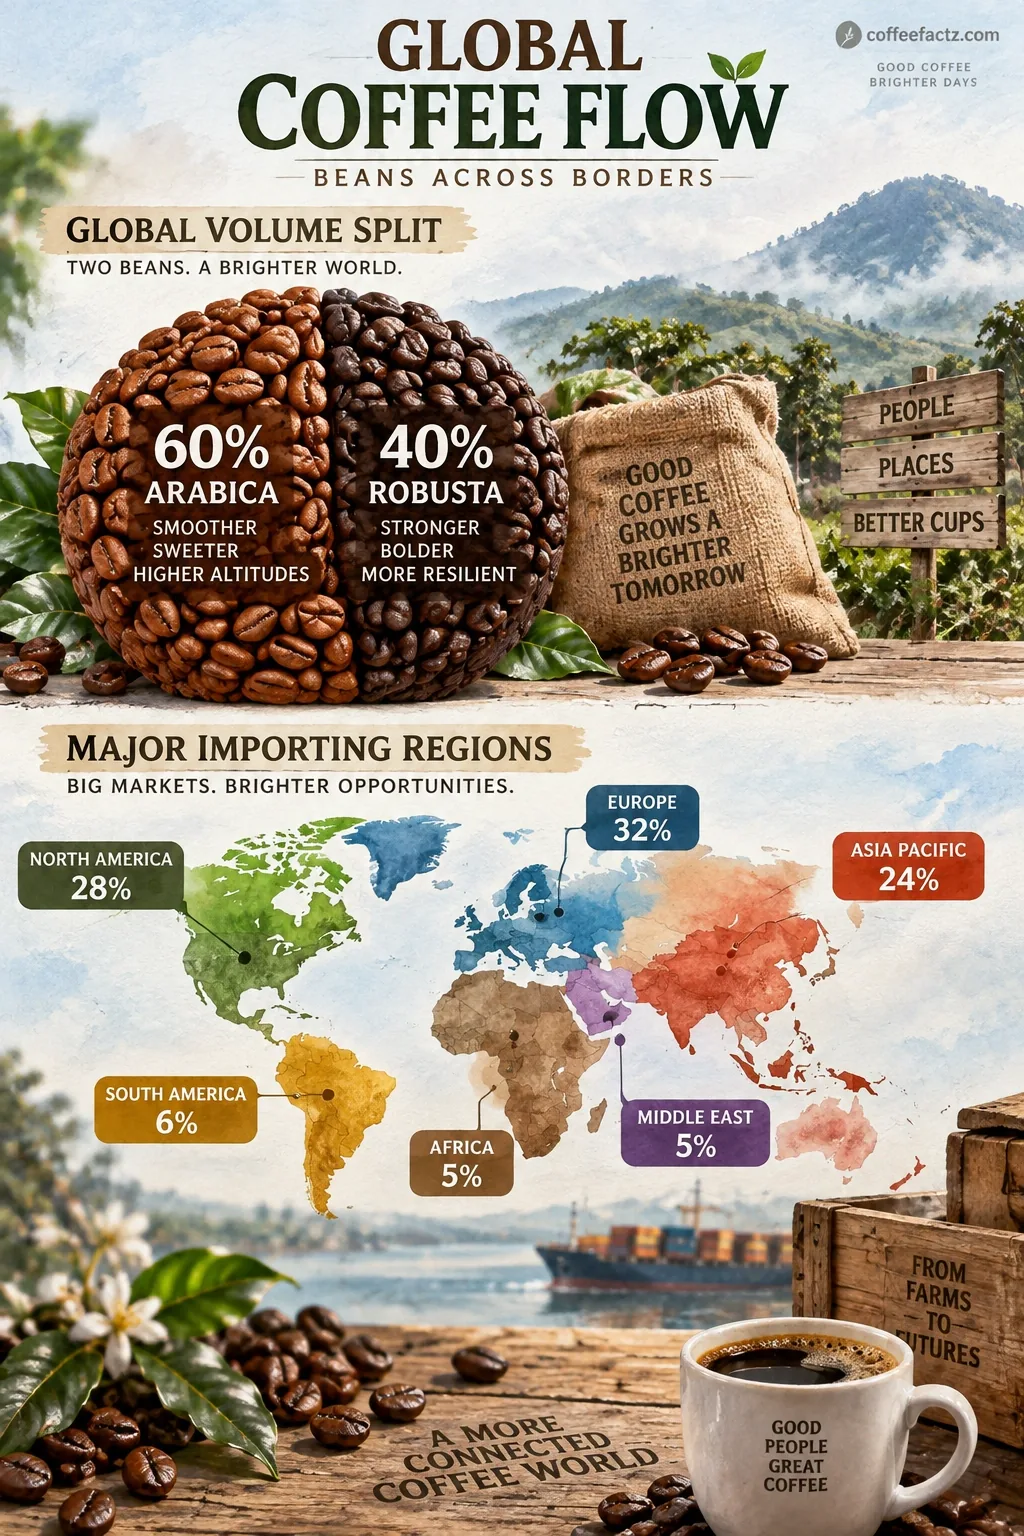
The global export split runs roughly 58% Arabica and 42% Robusta, and that ratio matters more than most volume tables acknowledge. The Arabica-Robusta price arbitrage shifts year to year, and when it moves sharply, origins that lead with the cheaper species look more or less competitive depending on which side of the spread you’re buying.
Destination demand shapes the picture further. Europe absorbs roughly 40% of global coffee imports, the United States around 25%, and Asia approximately 15%. The US draws most of its coffee from Brazil and Colombia for the Arabica component and from Vietnam for the Robusta fraction that feeds commercial blends and solubles. The top importing markets by volume are the US, Germany, France, Italy, Japan, Belgium, Netherlands, Spain, the UK, and China.
Globally, Honduras ranks as the eighth-largest coffee exporter, the third-largest in the Americas, and the largest in Central America. – From the USDA Foreign Agricultural Service Coffee Annual Report
The most overlooked distinction in the entire topic is this: value-based exporter lists include Switzerland, Germany, Italy, the Netherlands, and France. These are processing and re-export economies that produce almost no green coffee. When an origin-focused buyer looks at a value-ranked list and sees European countries above Ethiopia or Honduras, the instinct is to conclude the list is wrong. The list isn’t wrong. It’s answering a different question. Commodity and volume buyers look at Brazil and Vietnam. Robusta buyers look at Vietnam and Indonesia. Washed Arabica and premium programme buyers look at Colombia and Ethiopia. Anyone reading a value-ranked list should first check whether those five European hubs are being counted as exporters before drawing any conclusions.
#1 Brazil: 35-40M+ Bags and the Only Origin That Wins on Every Lens
Brazil’s position at the top of this table is not a function of a favorable reference year or a particular methodology. It’s structural. No other origin holds the same rank under every ranking lens simultaneously.
Cerrado Estate Mechanization and Natural Processing
Brazil exports 35 to 40 million bags per year, representing more than 30% of world coffee supply. The volume is made possible by two things that work together: flat-land geography and natural processing.
The Cerrado and Sul de Minas regions are the production backbone. Cerrado in particular operates on an estate model with mechanized strip harvesting, where machines pass through rows of coffee trees and strip the cherries in a single pass. This is only feasible on flat or gently rolling terrain, and Brazil has it at a scale no other origin matches. The labor economics are fundamentally different from any other major producer.
Natural processing is the dominant preparation method. Cherries dry whole in the sun on raised beds or patios before hulling. This keeps water usage low, eliminates the wet-mill infrastructure cost, and produces a cup with more body and fruit-forward sweetness than washed coffees from the same variety. It also keeps the cost of production at the bottom of the Arabica range. When Arabica prices compress, Brazil’s cost structure means it continues to export profitably while higher-cost washed origins feel the squeeze first.
Santos Port, the Global Denominator Effect
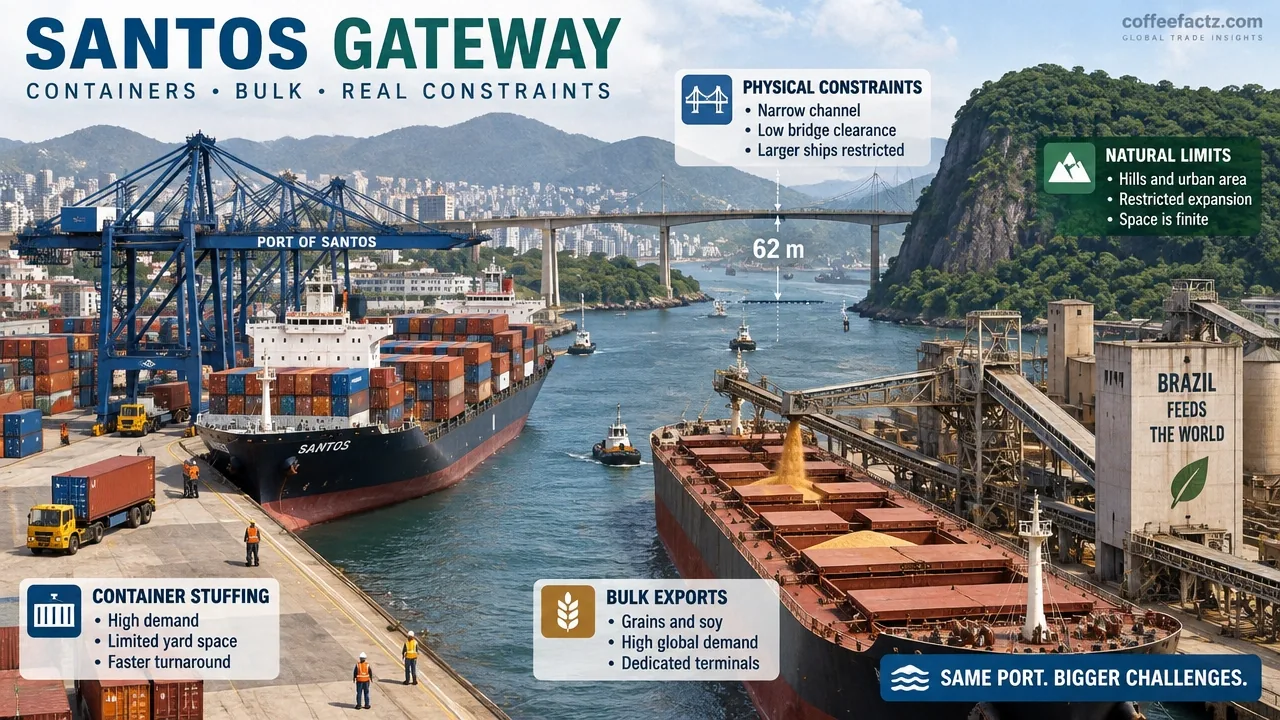
Santos is the primary export gateway for Brazilian coffee, handling both bulk and containerized shipments. Container stuffing capacity at Santos is substantial, but the port runs at or near capacity during peak harvest months, typically May through September. Shipping lead times lengthen, and traders who haven’t booked vessel space in advance face premium freight rates or delayed shipment windows. That’s a practical constraint, not a theoretical one.
The scale effect goes beyond Brazil’s own logistics. Because Brazil supplies more than 30% of world volume, its harvest cycle sets the tone for global differentials. A strong Brazilian crop pushes differentials down across the board. A short crop tightens supply and lifts differentials for competing origins. Every other origin’s market share in this article is measured against a Brazilian base, which means Brazilian weather in June is a pricing event for Colombian traders, Vietnamese exporters, and Ethiopian cooperatives simultaneously.
Brazil is the only origin in this table that holds #1 under both the export-volume lens and the export-value lens. Vietnam, Colombia, Indonesia, and Ethiopia all change position when the lens changes. Brazil doesn’t. That is the real definition of its dominance: not a single ranking, but the absence of any ranking that displaces it.
#2 Vietnam: The Robusta Engine Behind Global Supply
Vietnam exports 25 to 30 million bags per year, making it the world’s dominant Robusta supplier by a margin that no other origin comes close to challenging. What happens when Vietnam has a bad crop? The short answer: instant coffee prices move, espresso blend costs move, and commercial roasters across Europe and Asia start recalculating their forward positions.
The production base sits in the Central Highlands, with Dak Lak province as the center of gravity. The farming model is high-yield commercial agriculture optimized for Robusta’s natural robustness: the species tolerates lower altitudes, higher temperatures, and more intensive cultivation than Arabica. That’s not a quality compromise for the buyers who need it. Instant-soluble manufacturers and commercial roasters need consistent, high-soluble-solids Robusta at scale, and Vietnam delivers it more reliably than any other origin.
Hai Phong is the dominant export gateway for bulk Robusta moving into Asian and European markets. The logistics chain from Central Highlands farm to Hai Phong container yard is well-established and relatively efficient by regional standards, which is part of why Vietnam’s cost-to-port remains competitive.
The harvest timing in the Central Highlands runs roughly October through January, which interlocks with the Northern Hemisphere Arabica harvest window in a way that matters for the annual supply calendar. When both crops come in heavy, the global supply picture loosens. When Vietnam’s crop is short and the Colombian Mitaca is also thin, the market tightens from both species simultaneously.
Vietnam’s buyer structure is worth understanding separately from its production profile. Instant-soluble manufacturers and commercial roasters dominate Vietnam’s export book. Their contract behavior differs sharply from specialty roasters: longer forward positions, tighter specification tolerances on moisture and defect count, and price sensitivity that tracks the Arabica-Robusta spread closely. When Arabica prices spike, Robusta substitution increases and Vietnam’s export book gets more competitive. That arbitrage dynamic is the piece that most coverage of Vietnam simply omits.
Arabica beans contributed more than 60 percent of global coffee output, with the remainder supplied primarily by Robusta origins, of which Vietnam is the largest. – From a USAID Women in Coffee report
The export-economics read on Vietnam is the gap in almost every published source on this topic. Vietnam is the world’s second-largest coffee exporter and the largest Robusta supplier by volume, yet most coverage treats it as a quality-grading story rather than a supply-chain anchor. The right frame is the opposite: Vietnam is a commodity infrastructure story first, and the cup profile is a secondary consideration for most of its buyers.
#3 Colombia: The 10% Origin That Anchors Global Washed Arabica
Colombia exports roughly 11 to 13 million bags per year, approximately 10% of world coffee. That share sounds modest next to Brazil’s 30% or Vietnam’s 17%. What it understates is Colombia’s role as the price-setting anchor for washed Arabica programmes globally. When Colombian differentials move, every other washed Arabica origin’s pricing adjusts in reference to them.
Output Scale and the Dual Harvest System
Colombia is one of the world’s top three arabica coffee exporters, renowned for high-quality, washed arabica coffees with distinctive flavor profiles tied to diverse microclimates and elevations. – From World Coffee Research
Most major origins have one main harvest per year. Colombia has two. The main crop runs roughly October through February. The Mitaca, or fly crop, runs April through June. The Mitaca is smaller than the main crop, typically 25 to 40% of annual volume depending on the region, but its timing is what makes Colombia commercially distinctive. It fills a supply window when most other washed Arabica origins have no fresh crop to offer. Buyers who need consistent fresh-crop Colombian throughout the year are contracting against both harvests, not just one.
The dual harvest is not a quirk of Colombian agriculture. It’s a direct consequence of the country’s geography: the Andes split the growing regions across different altitude bands and microclimates, some of which experience their main flowering cycle offset from others. The Mitaca is effectively a second main crop in regions where the rainfall pattern supports a second flowering. That structural feature is what gives Colombian washed Arabica its year-round availability and why no other single-origin programme can replicate it at the same scale.
FNC Oversight, Contract Grading, and Pacific Logistics
The FNC (Federación Nacional de Cafeteros) has overseen Colombian coffee quality and export standards for nearly a century. The Café de Colombia geographical indication, registered in multiple markets, legally protects the name for coffee grown, processed, and exported from Colombia. For buyers, the GI functions as a market signal: a Café de Colombia-marked lot has met the FNC’s baseline quality standards and passed its certification process. That’s not a guarantee of cup score, but it is a guarantee of provenance and minimum specification.
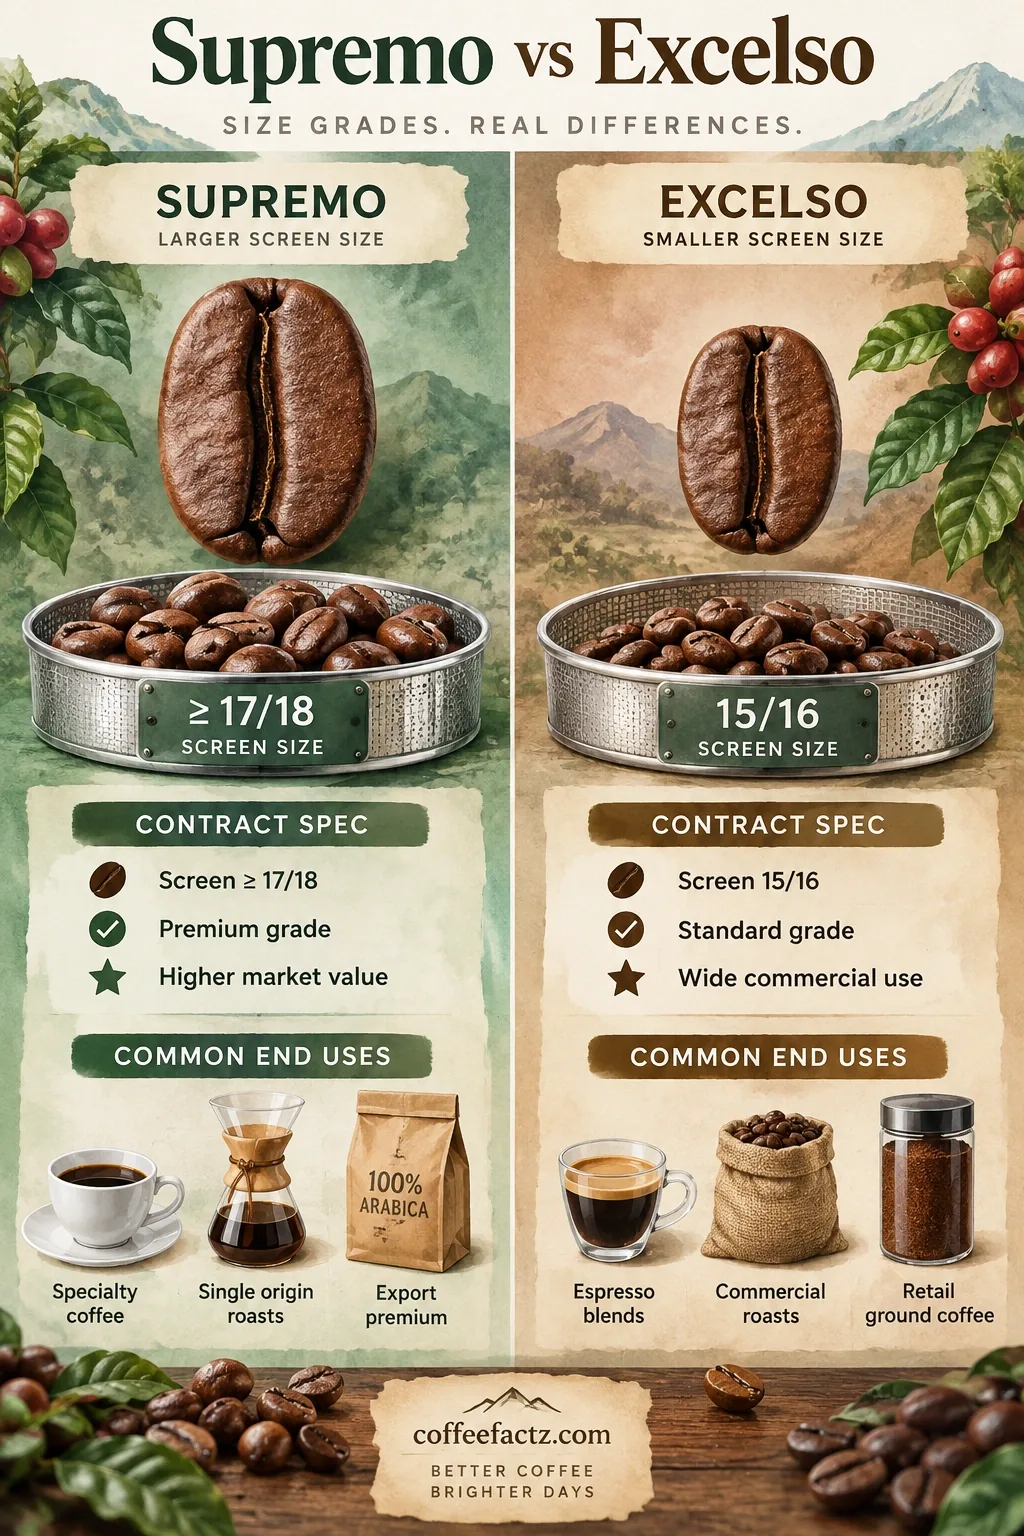
The grading system is where contract specifications get precise. Supremo is the top commercial grade, sized at screen 17 or 18, meaning the beans are retained on a 17/64-inch or 18/64-inch mesh. Excelso runs screen 14 through 16. The screen-size difference matters practically: Supremo beans roast more evenly at a given development time because they’re more uniform in size. Excelso is the workhorse grade for most commercial buyers. Specialty contracts often specify Supremo as a minimum, then layer additional cupping requirements on top.
Buenaventura on the Pacific coast is Colombia’s primary export gateway for washed Arabica. The concentration of volume through a single port creates real logistics risk. Port congestion at Buenaventura, which has occurred repeatedly during peak shipment windows, lengthens lead times and can delay fresh-crop lots by weeks. Buyers who need precise arrival timing for seasonal marketing programmes plan around Buenaventura’s capacity constraints as a standard part of their logistics model.
#4 Indonesia: Wet-Hulled Specialty and Underrated Commercial Volume
Indonesia exports 6 to 8 million bags per year. That figure consistently surprises buyers who have looked at production tables first, because Indonesia’s production sits in the same band as Colombia: 10.9 to 12.9 million bags. A substantial share of the crop is absorbed domestically or consumed before it reaches the export stage. This is precisely why production-ranked lists place Indonesia far higher than export-ranked lists do, and why readers who learn Indonesia at #4 are confused when they find it lower or absent on lists that use different methodology.
The production geography spans three major islands. Sumatra is the volume anchor, known internationally for the wet-hulled style. Java carries the older colonial-era reputation and produces both estate and smallholder lots. Sulawesi offers a smaller but commercially distinct profile, particularly from the Toraja and Flores growing areas.
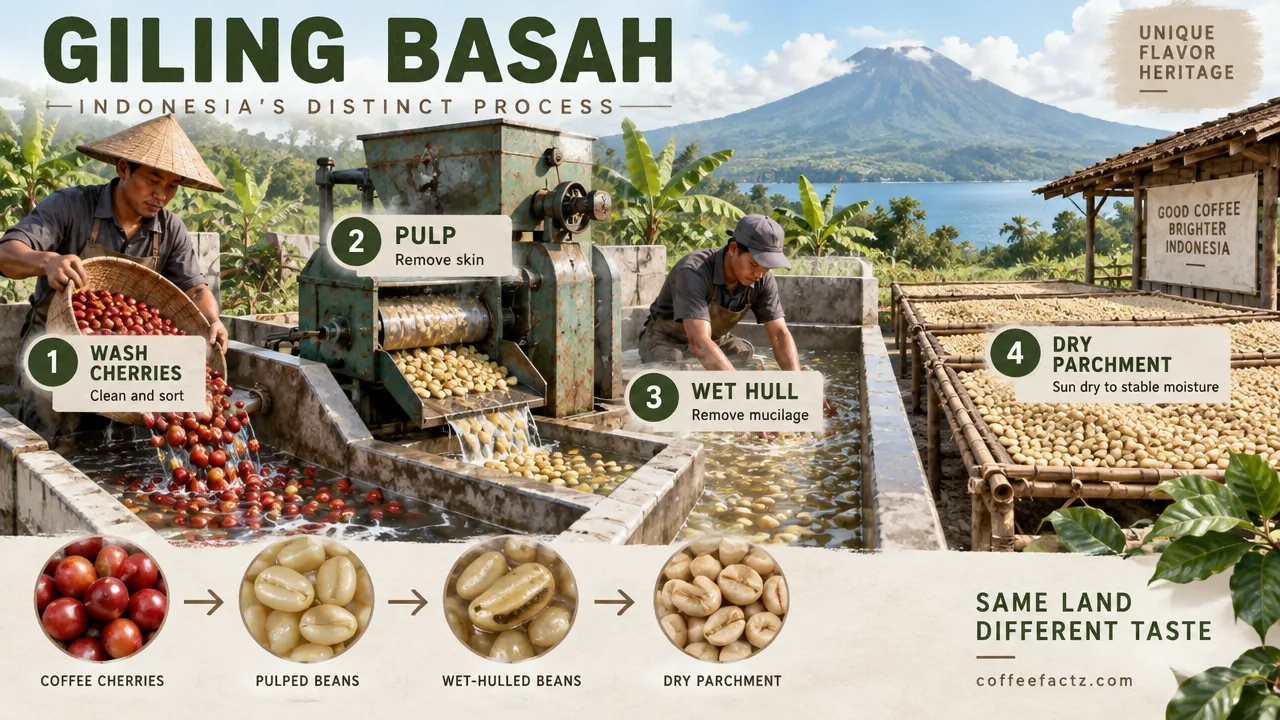
Wet-hulling, or giling basah, is the processing technique that defines Indonesian Arabica for most international buyers. In conventional washed processing, parchment-covered beans dry slowly to low moisture content before hulling. In wet-hulling, the parchment is removed while the bean still carries high moisture, typically 25 to 35%. The exposed bean then dries to export moisture. The result is a distinct cup: lower acidity, heavier body, earthy and sometimes herbaceous character. It’s a profile that divides opinion, but buyers who want it can’t replicate it from any other origin.
Commercial Robusta is the volume base underneath the specialty Arabica story. Indonesia’s Robusta, grown primarily in South Sumatra and Lampung, feeds the same instant-soluble and blend markets as Vietnamese Robusta, at lower volumes but with a different flavor profile.
The inter-island aggregation logistics that precede any export shipment add complexity that buyers from simpler single-island origins don’t face. Lots from Sumatra, Java, and Sulawesi each move through different collection and milling infrastructure before reaching a Java-based export facility. That aggregation layer is where processing inconsistency enters the supply chain, and it’s the reason Indonesian specialty lots carry more cup-to-cup variance than Colombian or Ethiopian washed lots of equivalent grade. Buyers who work Indonesian origins price that variance into their tolerance, because the profile uniqueness is not available elsewhere.
#5 Ethiopia: The Genetic Birthplace of Arabica and the Compliance Squeeze
Ethiopia exports 4 to 5 million bags per year and occupies a position in the supply chain that no other origin can claim: it is the genetic origin of Arabica coffee. The heirloom landraces growing wild and semi-wild across Ethiopian highlands represent a genetic diversity that cultivated varieties elsewhere simply don’t have. That’s not a marketing narrative. It’s a traceability asset. When a buyer sources from Sidama or Yirgacheffe, the provenance claim is grounded in genuine botanical history.
Heirloom Landraces and Cooperative Aggregation
Both natural and washed processing are commercially significant in Ethiopia. Washed Yirgacheffe lots, with their characteristic floral and citrus character, anchor premium filter programmes for specialty roasters. Natural Sidama and Harrar lots serve a different buyer profile entirely, one that wants the wine-like fruit intensity that Ethiopia’s naturals deliver at their best.
The production structure is almost entirely smallholder. Individual plots are typically less than two hectares. Cooperative washing stations are the aggregation layer between farmgate and export: farmers deliver cherry to the station, where it’s sorted, processed, and prepared for export under the cooperative’s lot identity. The washing station is where traceability either gets built or breaks down, and in Ethiopia, the quality of that record-keeping varies considerably across cooperatives.
EUDR Compliance and Who Bears the Cost
The EU Deforestation Regulation (EUDR) requires exporters and cooperatives supplying the European market to demonstrate that their coffee was not produced on land deforested after December 31, 2020. In practice, that means geolocation data at the plot level, documented supply chain due diligence, and risk assessment paperwork that satisfies EU customs authorities.
For a large, well-resourced exporter, this is an administrative burden. For a smallholder cooperative in Sidama working with farmers on plots under two hectares, it is a structural challenge. The compliance infrastructure, GPS mapping, document management systems, and legal review, costs money that sits at the cooperative level, not the farmgate level.
A 2025 SSRN working paper quantifying EUDR impacts on Colombian smallholder coffee producers found that cooperatives of 500 farmers face compliance costs of $105,000 to $215,000, with 96% of the country’s 540,000 producers cultivating less than five hectares and 52% of rural properties carrying informal land tenure. The study estimated that without intervention, up to 280,000 coffee-farming families, representing 50% of the sector, face exclusion from the European market, which accounts for 30% of Colombian exports valued at $580 to $700 million annually.
The Colombian figures are the most granular published data available on EUDR compliance costs in a smallholder context. The structural conditions in Ethiopia, small plots, informal tenure, cooperative aggregation, are comparable in many ways. The compliance cost burden doesn’t disappear because it isn’t being measured. It gets absorbed somewhere in the supply chain, and the entity least able to absorb it is typically the one closest to the farm.
#6 Honduras: Central America’s Quiet Volume Leader
Honduras exports 4 to 5 million bags per year, making it the largest coffee exporter in Central America and a consistent presence in the global Top 10. It is also, relative to its volume, one of the least covered origins in trade press.
The production model is high-altitude shade-grown Arabica, grown across six distinct regions including Copán, Montecillos, and Agalta. Elevation runs from 1,000 to over 1,600 meters, with shade canopy providing the temperature buffering that slows cherry development and concentrates sugars. The cup profile tends toward bright acidity with stone fruit and chocolate notes, a profile that fits comfortably in North American specialty and commercial programmes.
Harvest timing runs November through April, placing Honduras squarely in the Northern Hemisphere supply window that North American roasters depend on for fresh-crop lots. When Central American harvests are strong, roasters who need consistent washed Arabica availability through the spring have reliable supply from Honduras without competing against the Southern Hemisphere harvest cycle.
The visibility gap is real and worth naming directly. Honduras produces at a scale comparable to Ethiopia, yet it generates a fraction of the origin marketing, specialty press coverage, and consumer-facing storytelling. The reason is largely structural: Honduras doesn’t have a single dominant processing style, a famous regional appellation, or a national quality institution with the marketing reach of Colombia’s FNC. What it has is volume, consistency, and reliable logistics. For commercial buyers, that’s often exactly what they need. For origin storytelling, it’s a harder pitch.
Honduras ranks as the largest coffee exporter in Central America. – From the USDA Foreign Agricultural Service Coffee Annual Report
#7 Uganda: Africa’s Robusta Anchor and Its Specialty Upside
Uganda exports 4 to 5 million bags per year and holds a position in African coffee that is structurally similar to Vietnam’s in Asia: it is the primary Robusta supply anchor for the continent, with a growing Arabica line that is commercially distinct from the Robusta base.
Uganda is Africa’s top Robusta exporter. The Robusta grown in the Lake Victoria basin and central regions feeds European instant and soluble demand, the same buyer category that dominates Vietnam’s export book. The contract behavior is similar too: forward positions, specification-driven purchasing, and price sensitivity that tracks the Arabica-Robusta spread.
Mount Elgon is where the Arabica story lives. At elevations above 1,500 meters on the slopes of the extinct volcano that straddles the Uganda-Kenya border, smallholder farmers produce washed Arabica with a cup profile that draws genuine specialty buyer interest: bright acidity, stone fruit, and a clean finish that competes credibly with East African Arabicas from Kenya and Ethiopia. The Mount Elgon Arabica book is smaller than the Robusta base by a wide margin, but it’s growing, and it’s attracting the kind of specialty roaster attention that tends to precede meaningful premium development.
Smallholder aggregation through cooperatives is the dominant structure on both the Robusta and Arabica sides. The traceability challenge is the same one Ethiopia faces: individual plots are small, tenure documentation is inconsistent, and the cooperative washing station is where supply chain integrity either holds or frays. For EUDR-bound lots, that’s a compliance gap that buyers need to map before contracting.
#8 India: Monsooned Malabar and the Widest Rank Spread in the Table
India exports 3 to 4 million bags per year and appears anywhere from #4 to #8 across published rankings, the widest placement spread of any single origin in the available data. The gap tracks one methodological choice: whether a list counts processed and re-exported volume or origin-export volume only. Once you see that pattern, you can predict where most lists will disagree before you read them.
The production system is almost entirely shade-grown, with Arabica and Robusta both commercially significant. Most other major origins lead clearly with one species. India doesn’t. That dual-species structure gives Indian exporters flexibility in a shifting arbitrage environment but also makes India harder to categorize in origin-focused buyer programmes.
Monsooned Malabar is India’s most internationally recognized processing style and arguably its most distinctive commercial asset. Green coffee is exposed to monsoon winds in open warehouses on the Malabar coast for several weeks, absorbing moisture and swelling in size. The result is a low-acidity, heavy-bodied cup with a musty, earthy character that has no direct analogue in any other origin. It’s a polarizing profile: buyers who want it will pay for it specifically, and buyers who don’t want it will avoid it equally specifically.
Kaapi Royale is the premium washed Robusta designation, produced in Karnataka and targeting European and Middle Eastern buyers who need a higher-quality Robusta than standard commercial grades. The buyer mix for Indian coffee skews toward Europe and the Middle East, with specialty interest concentrated in the Monsooned Malabar segment and commercial interest in the Robusta base.
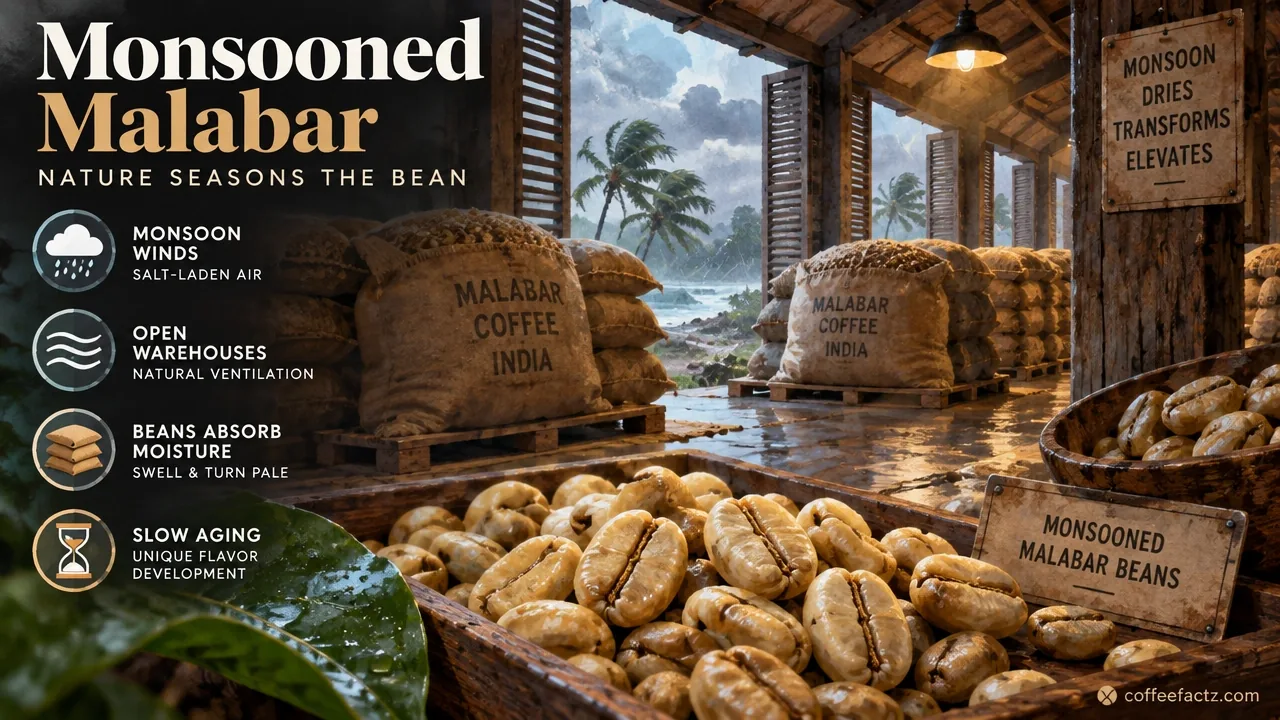
#9 Peru: Organic Arabica at Scale
Peru exports 3 to 4 million bags per year and holds a specific structural position that no other origin in the Top 10 occupies: it is the global leader in certified organic and Fair Trade Arabica at commercial scale. The enabling condition is geography. Andean cloud-forest microclimates in regions like Cajamarca, San Martín, and Junín provide the altitude, rainfall, and temperature range that Arabica needs, and the relative isolation of many growing areas has made chemical-intensive farming logistically difficult, which means organic certification is often describing an existing practice rather than requiring a fundamental change.
The production structure is almost entirely smallholder, aggregated through cooperatives. Those cooperatives are the certification holders, not individual farmers, which means the audit and compliance economics operate at the cooperative level. Buyers are concentrated in Europe and North America, where demand for certified organic and Fair Trade coffee is strongest.
The scope boundary on certification economics is worth stating plainly here: this section covers export volume and the structural conditions that make Peru’s certified volume possible. Certification premiums, audit costs, standards comparison, and the economics of certification access belong in a dedicated certification guide. Mixing those details into a volume ranking is what makes most lists that cover Peru either incomplete or misleading. The volume fact is 3 to 4 million bags of predominantly Arabica, a significant share of which carries organic or Fair Trade certification. The certification economics are a separate analysis.
#10 Guatemala: Microclimate Range at the Edge of the Table
Guatemala exports 2.8 to 3.5 million bags per year, placing it at the bottom of the Top 10 by volume. At this position in the table, the ranking is inherently less stable than the slots above it. Guatemala and Mexico have swapped in and out of the #10 position across different reference years and different data sources. The bottom of the table is separated by fractions of a million bags, and a single harvest event, a frost, a drought, or a disease outbreak, can reorder it.
What Guatemala offers buyers at this volume level is not scale. It’s microclimate diversity. The country compresses an unusual range of growing conditions into a small geographic area. Antigua sits in a volcanic valley at roughly 1,500 meters, with volcanic soil and a dry microclimate that produces a cup known for its chocolate and spice character. Huehuetenango in the northwest reaches elevations above 1,900 meters, with a dry wind from the Mexican plains that moderates temperatures and produces a brighter, more fruit-forward profile. These are not interchangeable cup profiles, and specialty buyers who work Guatemala typically specify the region, not just the country.
The commercial logic for an origin at the bottom of a volume table is different from the logic that applies at the top. Guatemala doesn’t compete with Brazil on scale or with Colombia on institutional infrastructure. It competes on profile specificity and microclimate range. In specialty contract negotiations, that’s a legitimate competitive position. A buyer building a single-origin filter programme doesn’t need ten million bags. They need a consistent, traceable, distinctive cup from a known region, and Guatemala’s top growing areas deliver that.
The bottom of this table is the least stable part of it. Which origin holds the #10 slot in a given year depends on the reference period, the methodology, and the harvest. That instability is not a flaw in the ranking. It’s an accurate reflection of how close the volumes actually are.
Verdict: Who Really Controls Global Coffee Export Volume
The honest answer to who controls global coffee export volume is a short list. Three slots are secure. Everything below that is negotiable.
Tier Bands and the Consensus Boundary
The ten origins in this ranking fall into four bands, and the gaps between bands are more meaningful than the gaps within them.
Tier 1 is Brazil alone. At 35 to 40 million bags and more than 30% of world supply, Brazil operates at a scale that no other origin approaches. The nearest competitor is roughly 10 million bags behind.
Tier 2 is Vietnam alone. At 25 to 30 million bags, Vietnam is the world’s Robusta anchor and the second-largest exporter by a margin that makes its position secure under any reasonable methodology.
Tier 3 is Colombia and Indonesia, each in the 6 to 13 million bag range depending on which figure you use for production versus export. Colombia is the washed Arabica price anchor. Indonesia is the wet-hulled specialty and commercial Robusta origin whose export volume significantly trails its production volume.
Tier 4 is everyone else: Ethiopia, Honduras, Uganda, India, Peru, and Guatemala, compressed into a narrow band from roughly 2.8 to 5 million bags where ranking precision is largely an artifact of the reference year. A single harvest shortfall moves any of these origins one or two slots in either direction.
The consensus boundary in this topic is narrow and shallow. Brazil at #1, Vietnam at #2, and Colombia at #3 are broadly accepted across sources. Everything from #4 to #10 is contested. That is the honest limit of what the industry agrees on.
Brazil and Colombia represented 60.4% of total green Arabica exports, whereas Vietnam accounted for 60% of total green Robusta exports. – From the International Coffee Organization Coffee Market Report
Volatile Rankings, Macro Risks, and Buyer Playbooks
Three macro risks have the capacity to reorder this table faster than any structural shift.
Red Sea shipping disruption on Asia-Europe lanes has already demonstrated its effect on freight economics: longer routes, higher bunker costs, and extended lead times that change the landed-cost calculation for origins shipping to European buyers. Vietnam and Indonesia feel this most directly, since their primary export routes to Europe transit the area. Ethiopian and Ugandan lots moving to European markets face similar exposure.
C-market futures volatility and the shifting Arabica-Robusta price arbitrage affect which origins look competitive in a given contracting window. When the spread between Arabica and Robusta widens, Robusta substitution increases and Vietnam’s book gets more competitive. When it compresses, washed Arabica origins from Colombia and Ethiopia hold their premiums more easily.
Climate volatility at origin is the least predictable and most consequential risk. Brazil’s crop is the global denominator, so a frost in Paraná or a drought in Minas Gerais is a global pricing event. Vietnam’s Central Highlands are increasingly exposed to irregular rainfall patterns. Ethiopia’s heirloom landraces are genetically diverse enough to buffer some climate stress, but the cooperative infrastructure that aggregates them is not.
The practical buyer playbook that follows from this structure is straightforward. Commodity and volume buyers anchor their supply on Brazil and Vietnam. Robusta buyers look at Vietnam and Indonesia for their primary positions. Washed Arabica and premium programme buyers build around Colombia and Ethiopia. Anyone reading a value-ranked list should verify whether Switzerland, Germany, Italy, the Netherlands, or France are being counted as exporters before using the list for origin sourcing decisions.
Composition instability is the norm below #3, not the exception. Indonesia is omitted by some trackers and included by others. Mexico and Guatemala trade the #10 slot depending on the crop year. A credible Top 10 states its ranking lens. A reader who cannot find the lens stated should discount the list accordingly.
Frequently Asked Questions About Coffee Exporting Countries
Which country is the largest exporter of coffee?
Brazil is the world’s largest coffee exporter by a substantial margin, shipping 35 to 40 million bags per year and holding more than 30% of global supply. No other origin comes close, and Brazil holds the top position under both export-volume and export-value rankings simultaneously.
What are the top 5 coffee exporting countries?
The top five by export volume are Brazil, Vietnam, Colombia, Indonesia, and Ethiopia. The first three are broadly agreed upon across data sources; Indonesia and Ethiopia at #4 and #5 are more stable than the origins below them but can shift depending on the reference year and methodology.
Where does the US get most of its coffee?
The US draws most of its Arabica supply from Brazil and Colombia, and its Robusta component, used primarily in commercial blends and solubles, comes largely from Vietnam. Central American origins like Honduras and Guatemala also supply significant volumes to North American roasters, particularly for specialty programmes.
Why do value-based exporter lists include European countries like Switzerland and Germany?
Switzerland, Germany, Italy, the Netherlands, and France are major coffee processing and re-export hubs. They import green coffee, roast or process it, and re-export the finished product, generating high export value without producing any green coffee domestically. Origin-focused buyers looking for producing-country rankings should use export-volume lists, not export-value lists.
How does the Arabica-Robusta price spread affect which origins look competitive?
When Arabica prices spike relative to Robusta, commercial buyers increase Robusta substitution in blends, which benefits Vietnam and Indonesia. When the spread compresses, washed Arabica origins like Colombia and Ethiopia hold their premiums more easily. The arbitrage dynamic shifts which origins look attractive in a given contracting window without changing the underlying volume rankings.
Why does Indonesia appear at different positions across different rankings?
Indonesia’s production volume (10.9-12.9 million bags) sits in the same band as Colombia, but its export volume (6-8 million bags) is significantly lower because a large share of the crop is absorbed domestically. Production-ranked lists place Indonesia much higher than export-ranked lists do, which is the source of most of the confusion.
What does the EUDR mean for coffee buyers sourcing from smallholder origins?
The EU Deforestation Regulation requires plot-level geolocation data and documented supply chain due diligence for coffee entering the European market. For origins like Ethiopia and Uganda, where production is almost entirely smallholder and land tenure documentation is inconsistent, the compliance burden falls on cooperative-level infrastructure that wasn’t built for this purpose. Buyers need to verify compliance readiness before contracting European-bound lots from these origins.
How stable is the #10 position in the global export ranking?
It’s not stable. Guatemala and Mexico have traded the slot across different reference years, and the margins separating the bottom half of the table are fractions of a million bags. A single drought, frost, or disease outbreak can shift multiple rankings simultaneously. Any list that presents the bottom of the Top 10 with high precision is overstating the certainty in the underlying data.
References
- Coffee Annual Report – Honduras | fas-prod.azureedge.us
- Women in Coffee Report | usaid.gov
- Coffee Market Report October 2018 | ico.org
- Colombia Country Profile | worldcoffeeresearch.org
- EUDR and Colombian Smallholder Coffee Producers – SSRN Working Paper | papers.ssrn.com
