

Splintering coffee industry market trends in 2026 are exposing a fault line that runs from Brazilian farms through Vietnamese Robusta mills to the espresso bar in your neighborhood. The C-market hit record highs. Climate models threaten half of current Arabica land by 2050. And Gen Z has quietly made cold brew the default order.
The numbers look optimistic on the surface. Combined global coffee revenue projections push past $500 billion. But the market frames contradict each other, farm-gate economics are invisible in most reports, and the operators who survive the next cycle will be the ones who understand why, not just what.
Key Takeaways on Coffee Industry Market Trends
- Market-size figures from different research firms measure different scopes and cannot be blended into a single number without distorting your planning assumptions.
- Arabica C-price volatility and Robusta substitution are structural, not cyclical; single-species sourcing strategies carry concentration risk that needs active management.
- Up to 50% of current Arabica growing land faces climatic suitability loss by 2050, and genetic adaptation through F1 hybrids and Fine Robusta is promising but unproven at commercial scale.
- Farm-gate cost data, including fertilizer, labor, freight, and currency risk, is absent from most market reports, making supply security harder to assess without direct origin relationships.
- Cold beverage formats now exceed 60% of sales at leading commercial chains, driven by Gen Z preferences, and the revenue-volume inversion between out-of-home and at-home channels shows where margin actually lives.
- EUDR compliance is a data infrastructure problem, not a marketing exercise; importers without automated geospatial traceability face up to 10% higher administrative costs and real market access risk.
The Market Size Trap: C-Price Shocks, Premiumization, and the Real Economics of Coffee
The coffee market is large, growing, and almost impossible to size accurately. That’s not a research failure. It’s a coffee market size question, and it matters practically because the number you cite shapes every investment decision you make.
Revenue Frame Reconciliation
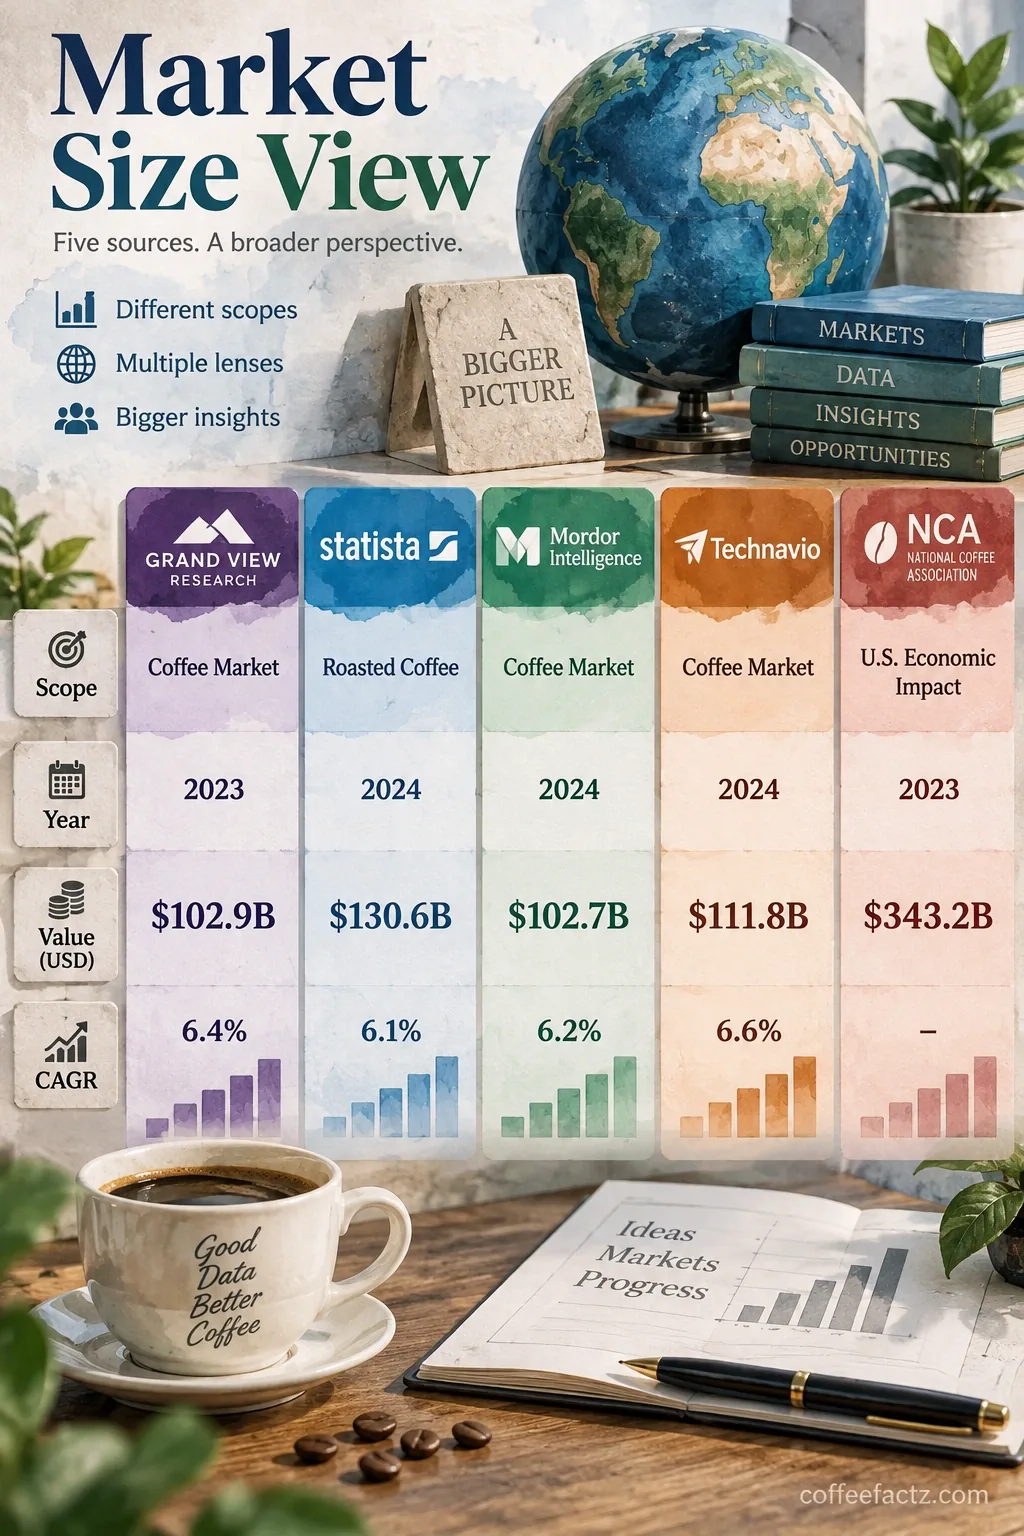
Market-size figures for coffee are not interchangeable, and blending them into a single headline number is how analysis goes wrong. Each major research firm measures a different scope.
Grand View Research puts the global coffee market at $249.3 billion in 2025, projecting $375.5 billion by 2033 at a 5.2% CAGR. Mordor Intelligence reports $185.7 billion in 2026, reaching $247.7 billion by 2032 at 4.87% CAGR. Statista shows $521.9 billion in combined revenue for 2026. Technavio tracks $37.63 billion in incremental growth from 2025 to 2030 at 6.5% CAGR. The National Coffee Association puts the U.S. economic impact alone at $343.2 billion in 2022, covering 2.2 million jobs, over $100 billion in wages, and a return of $43 in domestic value for every $1 of imports.
These are not competing estimates of the same thing. They are different measurements of different scopes: retail value, combined at-home and out-of-home revenue, incremental demand growth, and total economic contribution. When a market report tells you “the coffee market is worth X,” the first question is always: which frame?
The ICO’s monthly trade data gives you something more operationally useful than any of those projections: real-time price benchmarks and trade flow signals. Use ICO metrics to track what’s happening now. Use the research firm projections to understand the directional size of the opportunity. Never use them interchangeably.
Commodity Benchmark Swings, Species Substitution, Specialty Tier Divergence
Price volatility in 2024 and 2025 was not a blip. It reflected structural supply disruptions compounding on each other. FAO world coffee prices rose 38.8% in 2024. Arabica climbed 58% year over year in December 2024. Robusta rose 70% in real terms over the same period, driven by production collapses in Vietnam (down 20%) and Indonesia (down 16.5%). Brazilian coffee exports to the U.S. fell 54.9% during August through November 2025.
The 2026/27 Brazil harvest is projected to be a record, which should pressure prices downward. But low global inventories and persistent weather risk mean volatility stays elevated regardless of the harvest headline. Price direction is not the same as price stability.
When Arabica prices spike, roasters substitute toward cheaper Robusta. This is not a brand decision. It’s a menu pricing decision, and at 70% real-term price increases, it becomes structurally significant. Blends shift. Consumer palates adjust. The substitution effect creates a feedback loop that takes years to unwind.
Meanwhile, specialty single-origin pricing operates on a different axis entirely. Premiumization demand is contributing a modeled +2.1% to overall market impact. Ready-to-drink coffee is the fastest-growing segment at 7.2% CAGR. Single-origin and specialty categories are tracking at 6.58% CAGR. Functional coffee ingredients are growing at nearly double the rate of traditional coffee categories.
The market is not moving in one direction. Commercial commodity and specialty premium are diverging, and operators positioned only in the middle are the most exposed.
Climate Risk and Genetic Adaptation: What Happens to Arabica Supply by 2050
Arabica supply risk by 2050 is not a hypothetical. The agronomic data is specific, the geographic exposure is mapped, and the genetic response is underway. What’s not settled is whether the adaptation arrives fast enough or cheap enough for most producers.
Temperature Exposure, Crop-Planning Uncertainty
The core threat is temperature exposure. Arabica (Coffea arabica) is a narrow-range crop. It grows best between 18°C and 22°C. A 1.5°C to 2°C global mean temperature rise, the range now considered probable by mid-century, pushes significant portions of current growing areas outside that band.
A peer-reviewed global modeling study applying MaxEnt species distribution modeling to 21 general circulation models projected that nearly half of current Arabica growing area could lose 20–40% of climatic suitability by the 2050s, with the median ensemble showing 37% of current area losing that suitability range. The study also projected uphill altitude shifts and reduced dry-season rainfall in key regions including Brazil. – From the study “Projected Shifts in Coffea arabica Suitability among Major Global Producing Regions Due to Climate Change“
The geographic pattern matters. Lower-altitude farms face the sharpest suitability declines. Higher-altitude farms may gain suitability temporarily as warming opens new elevation bands, but soil quality and infrastructure at those altitudes are rarely ready for immediate cultivation.
World Coffee Research, citing the work of Christian Bunn and colleagues, identified that the biggest supply losses will hit producers in hotter areas with long dry seasons, specifically parts of Brazil, India, and Central America, where almost 80% of current coffee areas could become unsuitable.
El Niño cycles add a planning layer on top of structural warming. A single strong El Niño event can compress or extend dry seasons unpredictably, making forward crop planning unreliable even for farms that sit within acceptable temperature ranges today. For green buyers writing contracts 12 to 18 months out, that uncertainty is a pricing and supply security problem right now, not in 2050.
Resilient Cultivar Trade-offs, Cup-Profile Limits
The agronomic response to climate exposure runs through genetic adaptation, and three pathways are getting the most attention: F1 hybrids, Coffea stenophylla, and the Fine Robusta movement in Vietnam and Uganda.
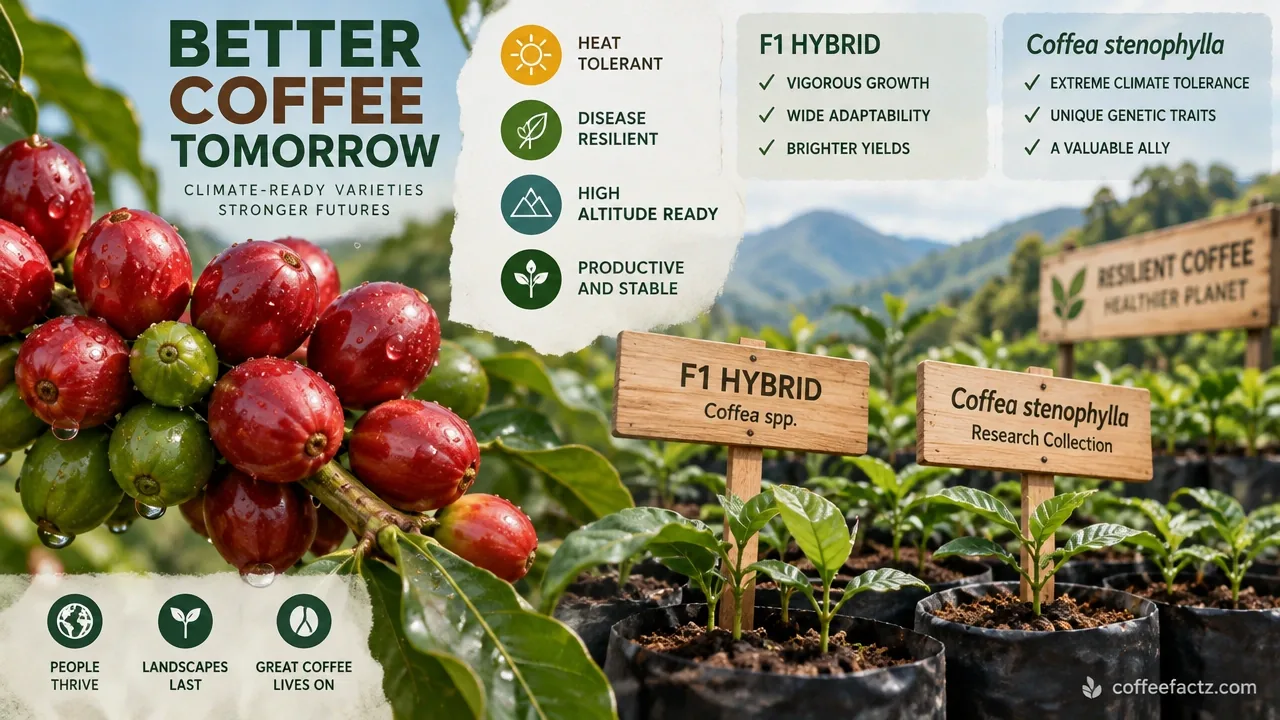
F1 hybrids are first-generation crosses between genetically distant Arabica parents, sometimes incorporating Coffea canephora (Robusta) genetics. The hybrid vigor effect produces meaningfully higher yields and stronger disease resistance than open-pollinated Arabica varieties. The trade-off is propagation cost: F1 seeds do not breed true, so farmers must buy new seed or tissue-cultured plants each cycle rather than saving seed from the harvest. That input cost is real and ongoing.
Coffea stenophylla is a West African species that tolerates temperatures up to 6°C higher than Arabica while reportedly producing cup quality closer to Arabica than Robusta. It’s genuinely interesting, but it remains at the research and micro-trial stage. Proven yield data at commercial scale does not yet exist. Cup profile reports are promising but come from controlled conditions, not commercial lot production.
As Tim Schilling of World Coffee Research has noted, the entire Arabica species is genetically constricted, with probably no more than 100 distinct varieties among the 800+ accessions in the Arabica World Collection. That genetic bottleneck limits how fast breeders can introduce meaningful new traits without crossing species boundaries.
Fine Robusta is the most commercially advanced of the three pathways. Uganda and Vietnam are both producing Robusta lots that, when farmed carefully, harvested ripe, and processed with the same discipline applied to specialty Arabica, cup at scores that earn premium pricing. The key word is discipline. Standard commercial Robusta gets commodity handling because it gets commodity prices. Fine Robusta requires selective harvesting, clean fermentation, and grading protocols that most Robusta supply chains are not currently built for.
The honest assessment: climate-resilient varieties solve heat and rust pressure. They do not automatically solve cup quality, market acceptance, or farmer economics. Each pathway requires different capital, different processing infrastructure, and different buyer relationships to convert agronomic potential into commercial value.
Origin Economics: The Cost Stack Behind Café Culture
Farm-gate costs are the foundation of every coffee experience, and they are almost entirely invisible in the market reports that shape how roasters and café operators plan their businesses.
Farm-Gate Expense Inputs, Retail Menu Disconnect
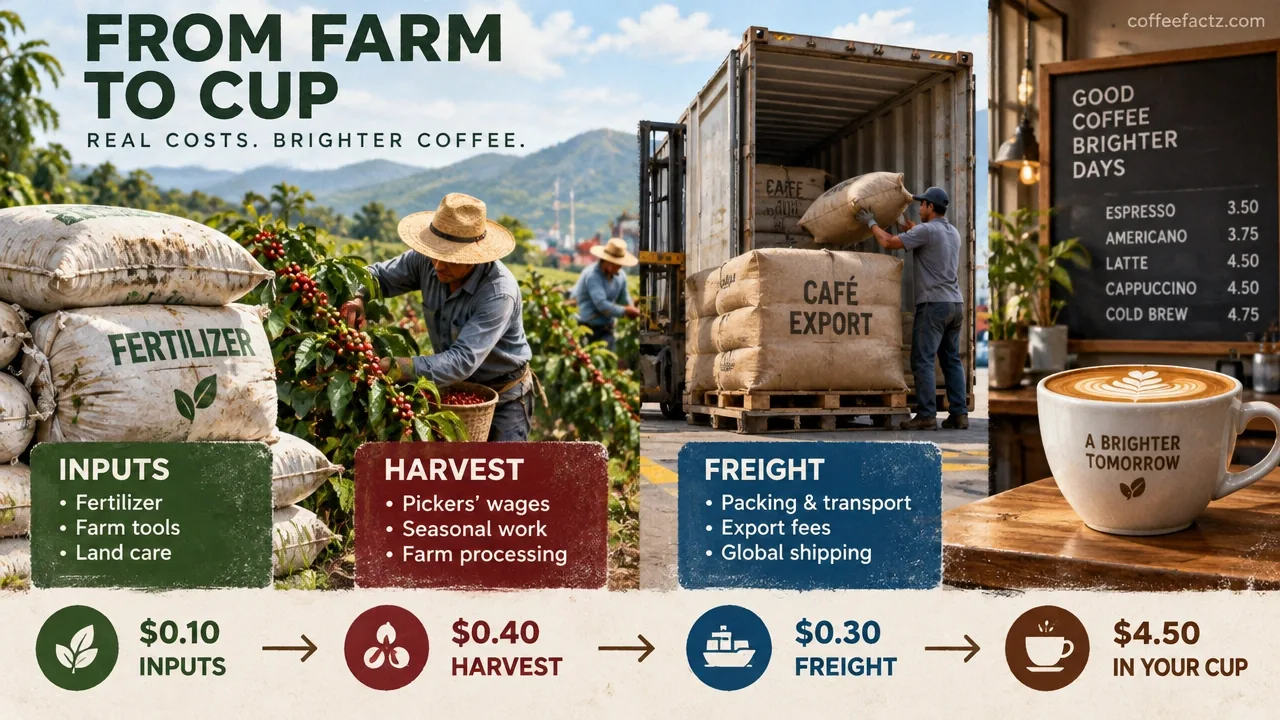
The cost stack at origin has four primary pressure points: fertilizer, labor, freight, and currency risk.
Fertilizer costs spiked globally after 2022 and have not fully retreated. For smallholder coffee farmers, fertilizer is often the single largest cash input, and price spikes hit them before any coffee price increase filters down to the farm gate. Labor shortages at origin are structural in many regions. Younger rural workers migrate toward urban employment. Harvest labor becomes seasonal, scarce, and expensive precisely when cherries need picking.
Freight volatility adds a logistics layer. Container availability, port congestion, and fuel surcharges fluctuate independently of green coffee prices, creating cost uncertainty between the farm and the roaster that neither party controls.
Currency risk compounds everything. A producer in Colombia, Ethiopia, or Guatemala earns in local currency but sells in U.S. dollars. When the dollar strengthens, their export revenue looks stable in USD but may decline in purchasing power for local inputs. When local currencies weaken, input costs in local terms can spike even if the dollar price of green coffee holds steady.
Caleb Benoit, Founder and CEO of Connect Roasters, describes how margin compression accumulates across the chain: a 75% gross margin at the café level collapses to 10–15% net margin once labor, rent, equipment, and operating costs are factored in.
Café operators see menu prices. They rarely see the fertilizer invoice, the harvest labor shortage, or the freight surcharge that preceded the green coffee price they paid. That disconnect is not just a knowledge gap. It’s a structural blind spot that makes supply risk harder to anticipate.
Source-Side Value Capture, Data Gaps
Value capture at origin is shifting. Producing countries are increasingly investing in domestic roasting and processing capacity, moving up the value chain rather than exporting only raw green coffee. When a farm or cooperative roasts and bags coffee before export, more of the retail value stays in the producing country. For buyers, that means sourcing relationships are becoming more complex: the supplier may now be a roaster, not just a green coffee exporter.
Alexis Gagnaire, Co-founder, Q Grader, and Green Coffee Buyer at Tanat, frames the stakes plainly: if excellence is not properly rewarded, many producers may be forced to choose volume over craftsmanship.
That’s the structural risk embedded in every market-size forecast that emphasizes revenue growth without examining producer margins. Over 25 million farmers depend on coffee cultivation as their primary income source. But farm-gate prices in USD per pound, living income benchmarks by region, fertilizer cost indices, and freight volatility data are absent from virtually every major market report. Growth projections that ignore whether producers can afford to sustain quality supply are incomplete by design.
For roasters and green buyers, the practical implication is direct: the data you need to assess supply security does not exist in standard market reports. You have to build it through origin relationships, direct communication with exporters, and your own cost-of-production benchmarking.
Processing Innovation: Anaerobic, Carbonic, Thermal Shock, and Co-Fermentation
Fermentation-driven processing has moved from competition novelty to a genuine quality frontier. The mechanism is real. The sensory outcomes are measurable. The risks are also real, and they scale with the complexity of the process.
Controlled Oxygen, Microbial Inoculation Mechanics
Anaerobic fermentation means fermenting coffee cherries or depulped beans in a sealed, oxygen-free environment. The absence of oxygen shifts microbial activity toward lactic acid bacteria and specific yeasts that produce different metabolic byproducts than aerobic fermentation. Those byproducts include compounds like ethyl acetate, lactic acid, and various esters that translate into fruit-forward, wine-like, or intensely floral cup profiles that washed or natural processing rarely produces.
Carbonic maceration borrows from winemaking. Whole cherries are placed in a sealed tank saturated with CO₂. The intracellular fermentation that occurs before the cherry skin breaks produces a distinct flavor profile, often described as juicy, low-acidity, and rounded, with reduced bitterness compared to standard natural processing.
Thermal shock processing uses rapid temperature changes during fermentation to stress microbial communities in controlled ways, influencing which flavor compounds develop. It’s a precision tool, not a standard protocol, and the specific outcomes depend heavily on the microbial population present at the farm.
Co-fermentation introduces external inoculants: commercial yeast strains, fruit pulp, cinnamon, or other substrates added to the fermentation tank. The added material provides additional fermentable sugars and flavor precursors, pushing the cup profile toward specific sensory targets. pH monitoring, temperature control, and timing are the three variables that determine whether the result is exceptional or a failed lot.
The common thread across all four methods is controlled intervention. Traditional washed and natural processing uses ambient microbial populations under variable conditions. These advanced methods attempt to engineer the microbial environment. When the engineering works, cupping scores climb. When it fails, the off-flavors are distinctive and hard to mask.
Lot Risk, Labeling, Buyer Verification
Lot risk in fermentation-driven processing is higher than in traditional methods, and it scales with process complexity. A miscalculated anaerobic fermentation can produce vinegar notes, rotting fruit, or sulfur compounds that render a lot unsaleable at specialty prices. Off-flavors from failed co-fermentation are not subtle. They’re obvious on the cupping table and they don’t roast out.
Consistency is the second risk. A producer who achieves an outstanding co-fermented lot in one harvest may not replicate it in the next if microbial populations, ambient temperature, or fruit quality shift. Buyers who build products around a specific process-driven profile need documented protocols, not just a label description.
Food safety and labeling add regulatory complexity, particularly for co-fermented coffees using fruit or dairy-derived substrates. Depending on the importing country, added fermentation ingredients may trigger labeling requirements or import inspection categories that standard green coffee does not face. Green buyers sourcing co-fermented lots should verify the specific substrates used and check import compliance before contracting.
For cupping and verification: evaluate process-driven coffees across multiple roast profiles, not just the producer’s recommended roast. A well-executed anaerobic lot should show process-driven character without dominating the cup at every roast level. If the fermentation flavor is the only thing present regardless of roast, the process may be masking rather than enhancing the underlying coffee quality. Request lot traceability documentation: fermentation tank logs, pH and temperature records, and the specific inoculants used in any co-fermentation.
Automation and Data Systems: From Café Equipment to Roast Profiling
Automation in coffee is not about replacing skill. It’s about deciding which tasks benefit from machine precision and which ones require human judgment. Getting that distinction right determines whether the capital expense pays off.
Beverage Service Robotics, Precision Dispensing
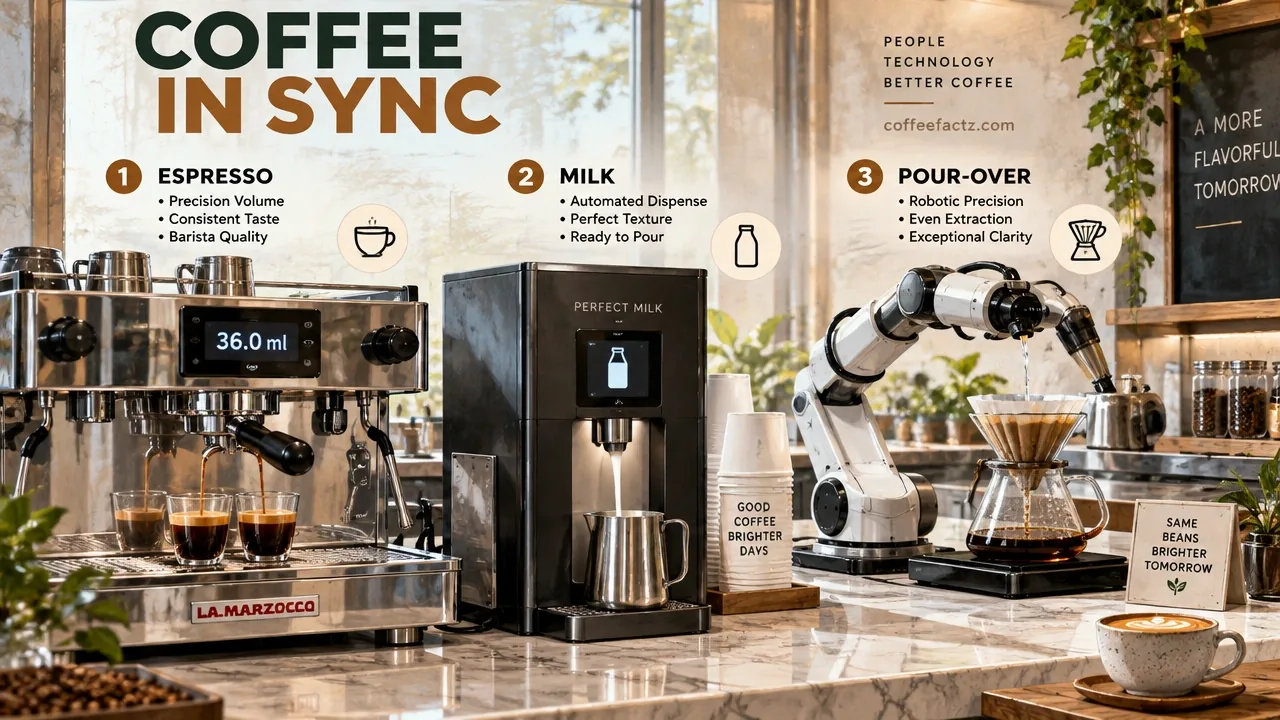
Precision volumetric espresso machines are the most widely adopted automation tier in specialty cafés. They control dose, pre-infusion pressure, and extraction volume to within tight tolerances, reducing shot-to-shot variance without requiring barista intervention on every pull. The quality floor rises. The ceiling depends on grind consistency and puck preparation, which remain manual steps in most setups.
Automated milk dispensers address one of the highest-variance tasks in a busy café: milk texture. Consistent steam temperature and texture requires significant barista training and attention. Automated systems remove that variable from the service equation, which matters most during peak hours when speed and consistency compete directly.
Robotic pour-over bars are the most visible form of café automation, but their practical application is narrower than the press coverage suggests. They excel at single-origin filter coffee programs where repeatability and brew recipe precision are the primary goals. They are not a labor replacement in a high-volume espresso bar. The capital cost is significant, the maintenance requirement is specialized, and the customer experience value depends heavily on your specific café concept and clientele.
The skill shift that automation creates is real and worth planning for. Baristas in automated environments spend less time on manual extraction technique and more time on system management, troubleshooting, and customer interaction. That’s a different training profile, not a lower-skill one. Operators who treat automation as a headcount reduction tool rather than a consistency investment typically underperform on both dimensions.
Julian Schöpf, Executive Partner at Brennpunkt Coffee, describes how connecting equipment data to specific staff shifts creates an accountability layer: knowing who was working when a consistency problem occurred gives managers a factual basis for coaching conversations rather than guesswork.
Green Sorting, Repeatability Logging, Batch Traceability
AI-driven laser green coffee sorting operates at a level of defect detection that visual hand-sorting cannot match at scale. Optical sensors identify density, color, and surface defects across thousands of beans per minute, removing quakers, broken beans, and foreign material with a consistency that protects roast evenness. For roasters working with microlot and specialty-grade green coffee, sorting quality directly affects cup score reproducibility.
Infrared roast profilers measure bean surface temperature in real time during the roast, giving roasters a more direct thermal signal than drum temperature or exhaust temperature alone. When integrated with Cropster or Artisan logging platforms, every roast becomes a documented data point: inlet temperature, rate of rise, first crack timing, development time, and exit temperature.
That data serves three distinct functions. First, it enables repeatability: you can reproduce a roast profile across different batch sizes and ambient conditions. Second, it supports quality control: deviation from a target profile flags a potential problem before the coffee reaches the customer. Third, it builds batch traceability: every bag of coffee can be linked to a specific roast event, a specific green lot, and a specific set of processing parameters. For operators selling to wholesale accounts or building a direct-to-consumer subscription, that traceability is increasingly a buyer expectation, not a differentiator.
Consumer Demand: Gen Z, Cold Beverage Hegemony, and Channel Shifts
Cold beverage demand has crossed from trend to structural category shift, and the demographic data behind it explains why this is not a seasonal menu decision.
Youth Preference Signals, Revenue-Volume Inversion
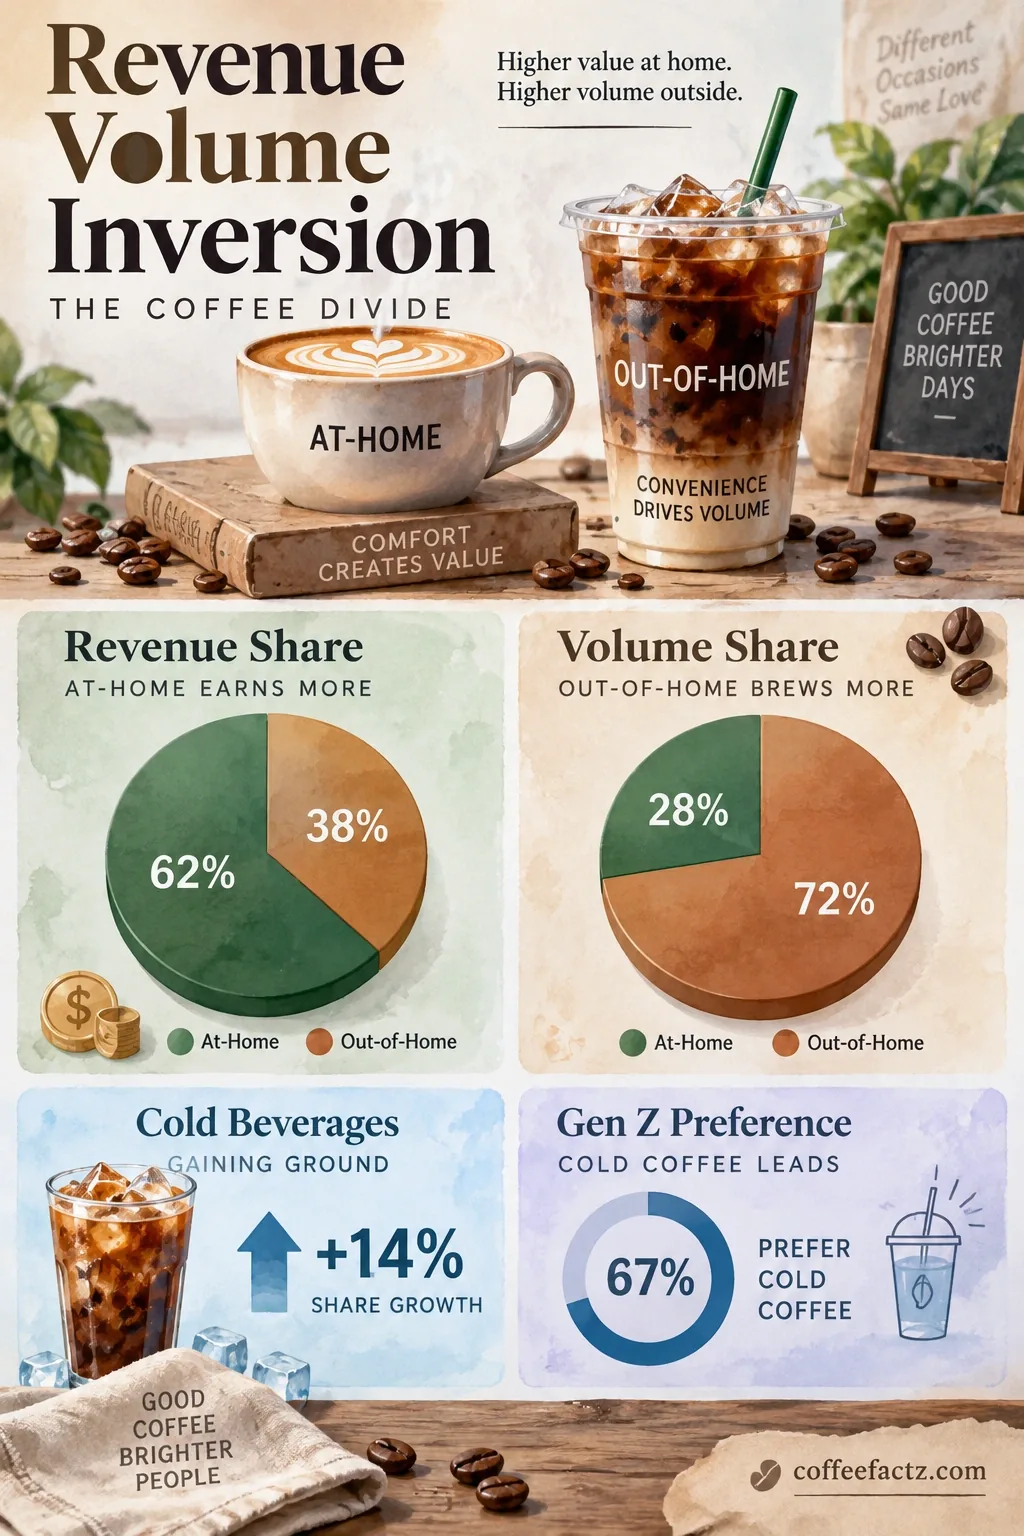
Gen Z cold coffee preferences are reshaping the sales mix at every commercial retail format. Approximately 68% of Gen Z consumers reportedly prefer cold coffee formats, though that figure should be treated as directional rather than definitive given variation across survey methodologies. What’s harder to dispute is the operational data: cold beverages exceed 60% of total sales for some leading chains, including Starbucks and Dutch Bros. Cold brew, nitro, draft espresso, and customized iced beverages have moved from menu additions to core revenue drivers.
Matcha is the adjacent signal worth tracking. Menu items featuring matcha grew over 30% year over year, and social mentions rose more than 107%. That growth does not come from matcha cannibalizing espresso. It comes from the same preference cluster: cold, customizable, visually distinctive beverages that perform on social media as well as they taste.
Chairil McClain, Vice President for Market Strategy at BUNN, notes that foodservice leaders across the industry see significant growth opportunity in the cold coffee segment and are actively investing in it.
The channel structure behind these numbers contains a puzzle worth examining. In 2026, at-home coffee revenue is projected at approximately $108 billion versus out-of-home at $413.82 billion, for a combined $521.87 billion. But at-home volume is 5.94 billion kilograms versus out-of-home volume of 1.26 billion kilograms. Out-of-home generates roughly four times the revenue on roughly one-fifth the volume. That revenue-volume inversion reflects the price premium of prepared beverages over retail packaged coffee, but the magnitude of the gap is striking and points to where margin actually lives in this industry.
Menu Architecture, Local Format Fit
Menu and operational implications of cold beverage dominance are more complex than adding a cold brew tap. Ice quality matters: dilution from low-density ice degrades the flavor of cold brew and nitro faster than most operators account for. Cold equipment, including nitrogen tanks, draft systems, and high-capacity ice machines, carries maintenance requirements and upfront costs that differ significantly from espresso equipment.
Seasonal menu design for cold beverages requires more lead time than hot menu changes because cold brew concentrate production, nitrogen charging, and ingredient sourcing for customization options all have longer preparation cycles. A seasonal cold beverage that sells out in week one and cannot be reproduced in week two damages the program more than not offering it at all.
Local demographics should drive the decision before capital is committed. A cold beverage program built for a Gen Z-heavy urban market may not generate the same ROI in a commuter suburb where the core customer is 45 years old and orders a drip coffee before 8 a.m. Assess your actual sales data by daypart and customer segment before repositioning the menu. Equipment ROI on a draft espresso system requires volume to justify the investment. If your current cold order percentage is below 30%, the infrastructure spend may not pencil out without a parallel marketing effort to shift behavior.
Sustainability and Traceability: EUDR, Living Income, and Packaging Mandates
Traceability is no longer a brand story. The European Union Deforestation Regulation turned it into a legal compliance requirement with measurable cost implications for every importer selling into the EU market.
Deforestation Due-Diligence, Geospatial Data
EUDR compliance requires importers to demonstrate that coffee was not grown on land deforested after December 31, 2020. The mechanism is geolocation: plot-level GPS coordinates for every farm in the supply chain, matched against satellite deforestation data. For operators sourcing from large cooperatives with hundreds of member farms, collecting and verifying that geospatial data is a significant data infrastructure problem.
The cost impact is quantifiable. EUDR trade barriers are modeled at a -0.8% impact on affected trade flows. Importers without automated traceability systems and geospatial mapping face up to 10% higher administrative costs compared to those with digital infrastructure already in place. Traceability technology reduces compliance validation time by up to half compared to manual documentation processes.
The implication for buyers is straightforward: automated traceability systems are not a future investment. They are the cost of maintaining EU market access. Operators who have not yet mapped their supply chain to plot level need to start that process now, before their next EU-facing contract renewal.
Producer Livelihoods, Material Rules, Claims Discipline
Living income benchmarks for coffee farmers vary significantly by country, household size, and local cost of living. Direct trade relationships that price above the C-market floor are one mechanism for closing the gap, but the gap itself is rarely quantified in buyer-facing sustainability claims. Operators who make living income commitments should be able to show the benchmark they’re measuring against, the farm-gate price they paid, and how that price compares to the benchmark. If that calculation doesn’t exist, the claim is marketing, not compliance.
Compostable and reusable packaging mandates are expanding across EU member states and several U.S. jurisdictions. Compostable packaging carries a specific regulatory risk: materials labeled as compostable must meet industrial composting standards (EN 13432 in the EU, ASTM D6400 in the U.S.) to make that claim legally. Home compostability is a different and higher bar. Packaging that meets industrial standards but is labeled “compostable” without qualification is a greenwashing liability in markets with active enforcement.
The discipline required here is operational, not creative. Before making any sustainability claim, roasters and café operators need three things: documented supplier proof of the claim (deforestation-free certification, living income pricing data, or material certification), a clear understanding of which regulatory standard applies in each market, and an internal audit process that catches gaps before a regulator or journalist does. Sustainability language that outruns your documentation is a reputational and legal exposure. Budget the compliance cost separately from the marketing budget, because they are not the same line item.
Strategic Forecast and Operator Playbook for 2026 and Beyond
The coffee market in 2026 is not a single trend. It’s a set of simultaneous structural pressures that reward operators who plan across multiple time horizons at once.
Harvest Outlook, Business-Model Shifts
The 2026/27 Brazil harvest is projected to be a record off-year crop in the biennial cycle, which should exert downward pressure on Arabica C-prices. But low global inventories mean that price relief may be smaller and shorter than the harvest headline suggests. Robusta fundamentals remain tight: Vietnamese and Indonesian production has not fully recovered from the supply disruptions of 2024 and 2025. The substitution trade that pushed roasters toward Robusta during the Arabica spike will not reverse quickly, because blends reformulated for cost reasons tend to stay reformulated.
For operators, diverging Arabica and Robusta fundamentals mean that a single-species sourcing strategy is a concentration risk. Roasters who built their blends entirely around Arabica are more exposed to C-price volatility than those with Robusta relationships. Roasters who shifted entirely to Robusta during the spike may face quality and positioning challenges as Arabica prices normalize.
Emerging business models are responding to these pressures in specific ways. Subscription roasters capture direct-to-consumer revenue at higher margins than wholesale, with better demand visibility for green coffee purchasing. Micro-lot auctions, including Cup of Excellence and similar platforms, create price discovery for exceptional lots that operate entirely outside the C-market. Direct trade relationships that include multi-season commitments give roasters supply security and give producers the planning horizon they need to invest in quality. Roasting at origin, where producers export finished roasted coffee rather than green beans, is the most structurally significant shift: it changes the value capture equation for producing countries and the sourcing relationship for buyers.
Resilience Scenarios, Query Responses
The operator playbook for 2026 and beyond comes down to five decisions made in parallel, not sequence.
C-price exposure management starts with knowing your green coffee cost as a percentage of your total cost of goods, and stress-testing that number against a 30% price increase. If the result breaks your margin, you have concentration risk that needs addressing through blend diversification, forward contracting, or pricing flexibility built into your customer relationships.
Traceability investment is not optional for operators with EU exposure. For operators without current EU sales, the EUDR compliance infrastructure still pays off through improved supply chain visibility and the ability to verify quality claims. Start with your top five green coffee origins and map the supply chain to plot level.
Cold beverage capability is a capital decision that should follow demand data, not precede it. If your cold sales are growing and your current equipment is the constraint, the investment case is straightforward. If you’re building cold capability speculatively, run the volume math first.
Automation ROI is position-specific. Volumetric espresso and data logging pay off in almost every commercial format. Robotic pour-over and fully automated milk systems pay off in high-volume formats with specific labor cost structures. Don’t buy automation because it’s available. Buy it because you can quantify what it replaces.
Origin relationships are the longest-lead investment and the hardest to replicate. A roaster with three years of direct communication with a specific farm has price, quality, and supply security information that no market report provides. Build those relationships before you need them.
Frequently Asked Questions About Coffee Industry Market Trends
What are the current trends in coffee?
The dominant trends are cold beverage growth, premiumization of specialty single-origin lots, processing innovation through anaerobic and co-fermentation methods, and automation investment in both café and roastery operations. Sustainability compliance, particularly EUDR traceability requirements, is also shifting from optional to mandatory for operators with EU market exposure.
What are the trends in the coffee market for 2026?
The record 2026/27 Brazil harvest is expected to pressure Arabica prices downward, but low global inventories and tight Robusta supply keep volatility elevated. Gen Z cold beverage demand continues reshaping retail sales mix, and EUDR enforcement is pushing traceability investment across the supply chain.
Will there be a coffee shortage in 2026?
A global shortage in 2026 is unlikely given the projected record Brazil harvest, but regional supply tightness remains real. Vietnamese and Indonesian Robusta production has not fully recovered from 2024 and 2025 disruptions, and low global inventories mean any weather disruption during the 2026/27 crop cycle could trigger rapid price spikes.
Are coffee prices rising or falling in the US?
Arabica prices rose approximately 58% year over year in December 2024 and remain elevated. The 2026/27 Brazil harvest should create downward pressure, but Brazilian exports to the U.S. fell 54.9% during August through November 2025, so the supply pipeline is not yet normalized. Expect continued volatility rather than a clean directional trend.
How does the EUDR affect green coffee buyers?
EUDR requires plot-level geolocation data proving that coffee was not grown on land deforested after December 31, 2020. Buyers sourcing from cooperatives with many member farms face significant data collection costs. Operators without automated traceability systems face up to 10% higher administrative costs compared to those with digital infrastructure already in place.
What is the Fine Robusta movement and does it matter for specialty buyers?
Fine Robusta refers to Robusta lots produced with selective harvesting, clean fermentation, and grading protocols similar to specialty Arabica standards, primarily in Uganda and Vietnam. When handled properly, these lots can cup at scores that earn premium pricing above commodity Robusta. For specialty buyers, it’s a real quality tier, but it requires the same supply chain diligence as specialty Arabica to verify process claims.
How should a roaster evaluate co-fermented coffee lots before buying?
Request fermentation documentation: tank logs, pH and temperature records, and the specific substrates used. Cup the lot across multiple roast profiles, not just the producer’s recommended development. A well-executed co-fermented coffee should show process-driven character without overwhelming the cup at every roast level. Also check import compliance for any added substrates if you’re selling into regulated markets.
Why does the revenue-volume inversion between at-home and out-of-home coffee matter?
At-home coffee accounts for roughly 5.94 billion kilograms of volume but only about $108 billion in revenue. Out-of-home generates $413.82 billion in revenue on 1.26 billion kilograms. That inversion shows that out-of-home prepared beverages carry dramatically higher per-unit value, which is why café and foodservice margins, even compressed ones, represent a larger share of total industry value than retail packaged coffee volume would suggest.
References
- Projected Shifts in Coffea arabica Suitability among Major Global Producing Regions Due to Climate Change | journals.plos.org
- Climate Change: Pinpointing the World’s Most Vulnerable Coffee Zones | worldcoffeeresearch.org
- Q&A with Tim Schilling, World Coffee Research | croptrust.org
- The ECS CoHo Interview Series: Alexis Gagnaire, Co-founder, Tanat | worldcoffeeportal.com
- Why Does a Latte Cost So Much? | vox.com
- Cold Is Hot | nacsmagazine.com
- How Technology Empowers Coffee Shops to Deliver Consistent Quality | freshcup.com