
Reliable K-Cup caffeine levels are harder to pin down than most coffee drinkers expect. Labels skip the number entirely, published ranges contradict each other, and the old “8-ounce cup” benchmarks were built for drip machines, not pods engineered around fixed coffee mass and variable brew sizes.
This guide closes that gap. We’ll work through the estimation formula, a transparent brand chart from decaf to extreme pods, the brewing mechanics that shift your actual dose, and the FDA-backed daily limits that tell you when enough is enough.
Key Takeaways on K-Cup Caffeine Levels
- Standard K-Cups deliver 75–150 mg per 8 fl oz; no federal regulation requires pods to disclose exact caffeine, so most labels don’t.
- The estimation formula (dose × bean caffeine concentration × extraction efficiency) gives you a comparable estimate, not a lab-verified figure.
- Dark roast does not mean more caffeine by mass; light roasts are denser and carry a slight per-gram advantage unless the dark pod uses more coffee or Robusta.
- Brew size at 6–10 oz extracts more efficiently than 12 oz; the strong button likely increases concentration by slowing flow, but its exact effect is machine-dependent.
- The FDA’s 400 mg/day adult ceiling drops to 200 mg/day during pregnancy; a single Death Wish or Devil Mountain pod exceeds the adult limit alone.
- Stop caffeine at least 8 hours before bed; slow CYP1A2 metabolizers may need more, because their half-life can stretch to 10+ hours.
Why K-Cup Caffeine Numbers Never Match
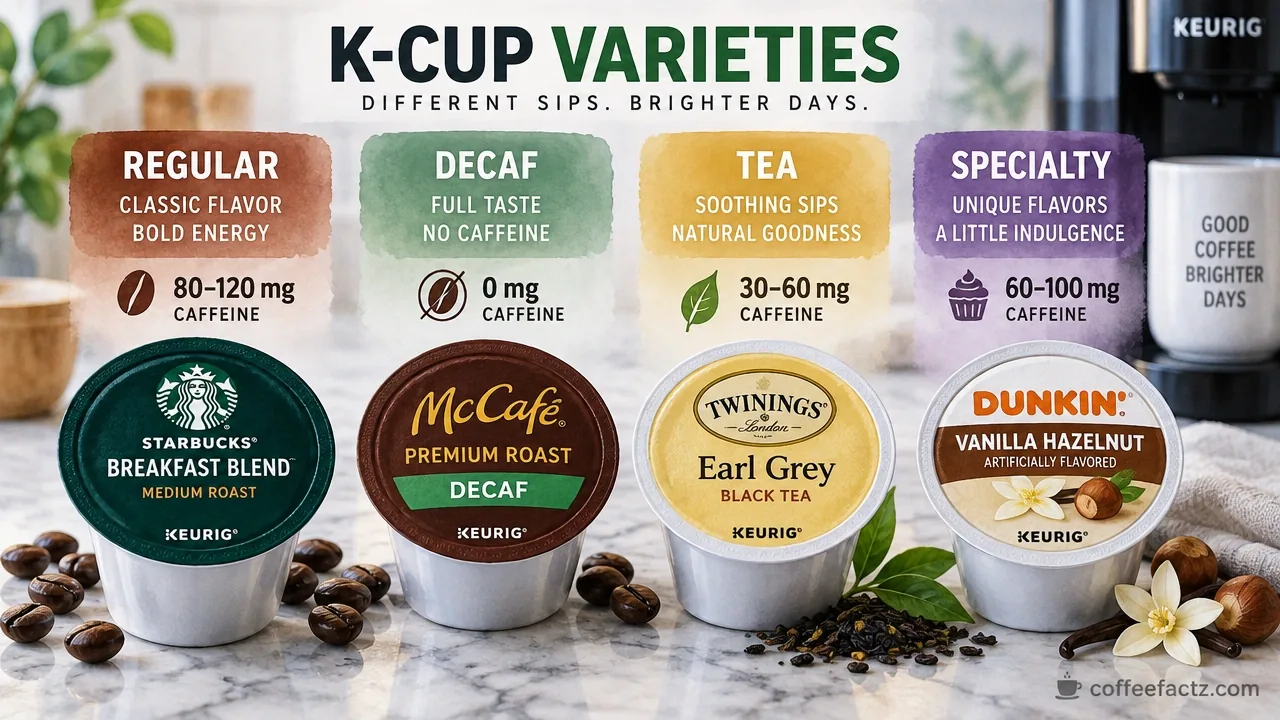
Every source gives you a different number because every source is measuring a different thing. The standard K-Cup caffeine range runs roughly 75–150 mg per 8 fl oz for regular coffee pods, 2–4 mg for decaf, 50–75 mg for tea pods, zero for herbal pods, and up to 60 mg for specialty beverage pods. That range is real. The problem is what sits underneath it.
Labels rarely show exact caffeine for three compounding reasons. First, green coffee beans vary in caffeine concentration by species, farm elevation, processing method, and even harvest year. A number printed on the box would require continuous lab testing to stay accurate. Second, package claims are manufacturer estimates, not extraction measurements. No federal regulation requires pod makers to test and disclose per-brew caffeine, so most don’t. Third, the old caffeine tables everyone still cites were built around a generic 8-ounce drip cup, where coffee mass, grind, temperature, and brew time were all bundled into one assumed average.
K-Cups broke that assumption. The pod standardized the coffee mass and the grind, but the machine kept varying everything else: brew size from 4 to 12 oz, water temperature by model, pressure by needle design, and extraction time by flow rate. So when you read “about 100 mg,” that figure might reflect a 6-oz brew on one machine from a manufacturer estimate made in 2018. Run the same pod at 10 oz on a different Keurig, and the number shifts.
Most values circulating online are ranges, manufacturer claims, or community reports with no disclosed methodology. That’s not a flaw in any one source. It’s the structural gap in K-Cup caffeine levels, since coffee pods have no standardized lab-reporting requirement.
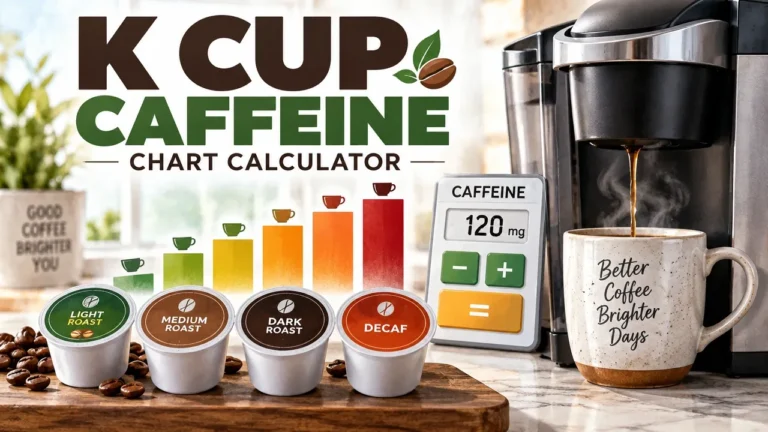
The K-Cup Caffeine Calculator: Formula, Two Levers, and How to Estimate Any Pod
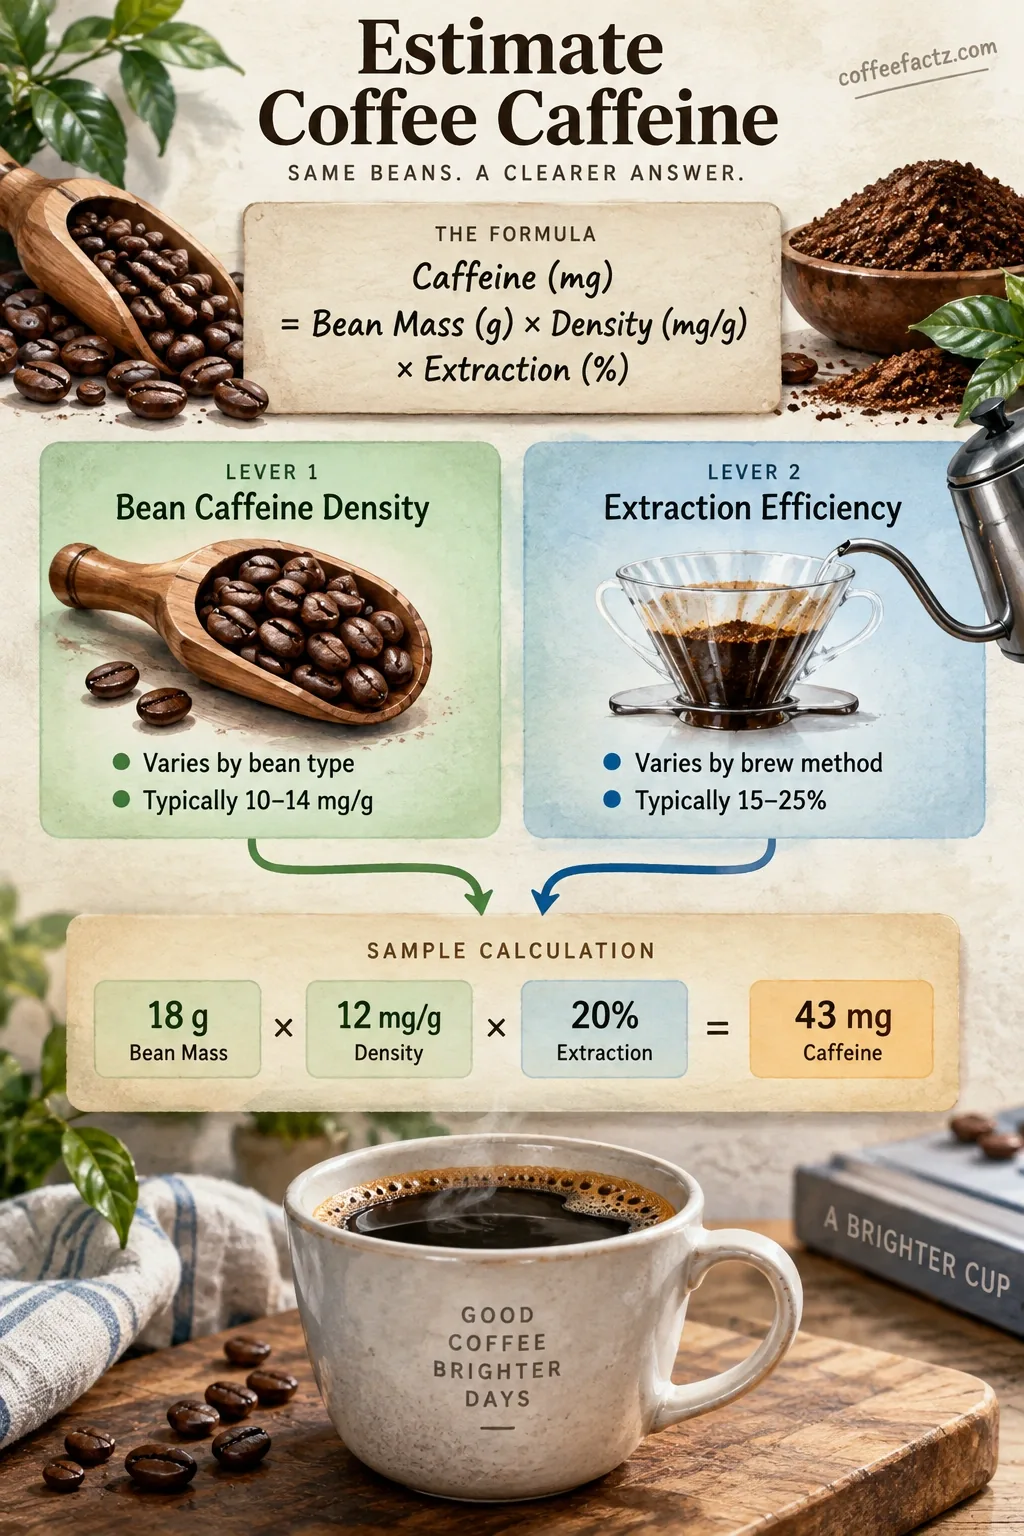
You can estimate the caffeine in any K-Cup without a lab. The formula is straightforward:
Total caffeine (mg) ≈ Coffee dose (g) × Bean caffeine concentration (% of mass) × Extraction efficiency
As Calm Coffee Roastery frames it more precisely: Caffeine (mg) = 1000 × Dose (g) × Green Coffee % × Roast Factor × Brew Factor. The 1000 multiplier converts the percentage fraction into milligrams. Every other variable plugs into one of two levers.
Lever one is bean caffeine density. This is everything upstream of the machine: species (Arabica vs. Robusta), origin, roast level, and the actual mass of coffee in the pod. Most standard K-Cups contain roughly 9–12 grams of ground coffee. Arabica typically runs 1.2–1.5% caffeine by dry mass. Robusta runs roughly double that. A pod with 10g of Arabica at 1.3% concentration carries about 130 mg of available caffeine before a single drop of water touches it.
Lever two is extraction efficiency. This is everything the machine controls: brew volume, water temperature, flow rate, grind size (fixed in the pod, but variable by manufacturer), and whether you press the strong button. Not all available caffeine makes it into the cup. Typical espresso-style extraction pulls 70–90% of available caffeine. Pod brewing under lower pressure extracts somewhat less, and larger brew volumes dilute concentration even when they increase total yield.
To use the formula practically: if the pod packaging lists coffee mass and identifies the bean type, plug in the numbers and treat the result as an estimate. If the packaging lists nothing, use the manufacturer’s published range as a labeled estimate, not a lab measurement. No source in this category provides independently verified extraction data. That’s not a minor caveat. It’s the largest credibility gap in K-Cup caffeine content.
The formula’s real value isn’t producing an exact milligram count. It’s letting you compare pods on the same set of assumptions, so a 10g Robusta pod and a 9g Arabica pod stop looking equivalent just because they’re both “medium roast.”
Roast Myths, Bean Species, and the Real Extraction Story
Coffee extraction is where most caffeine confusion lives, and two myths dominate the space: that dark roast means more caffeine, and that a bigger cup always means a bigger dose. Both are wrong in the same direction. They confuse intensity with chemistry.
Varietal Variation and Darker Profiles
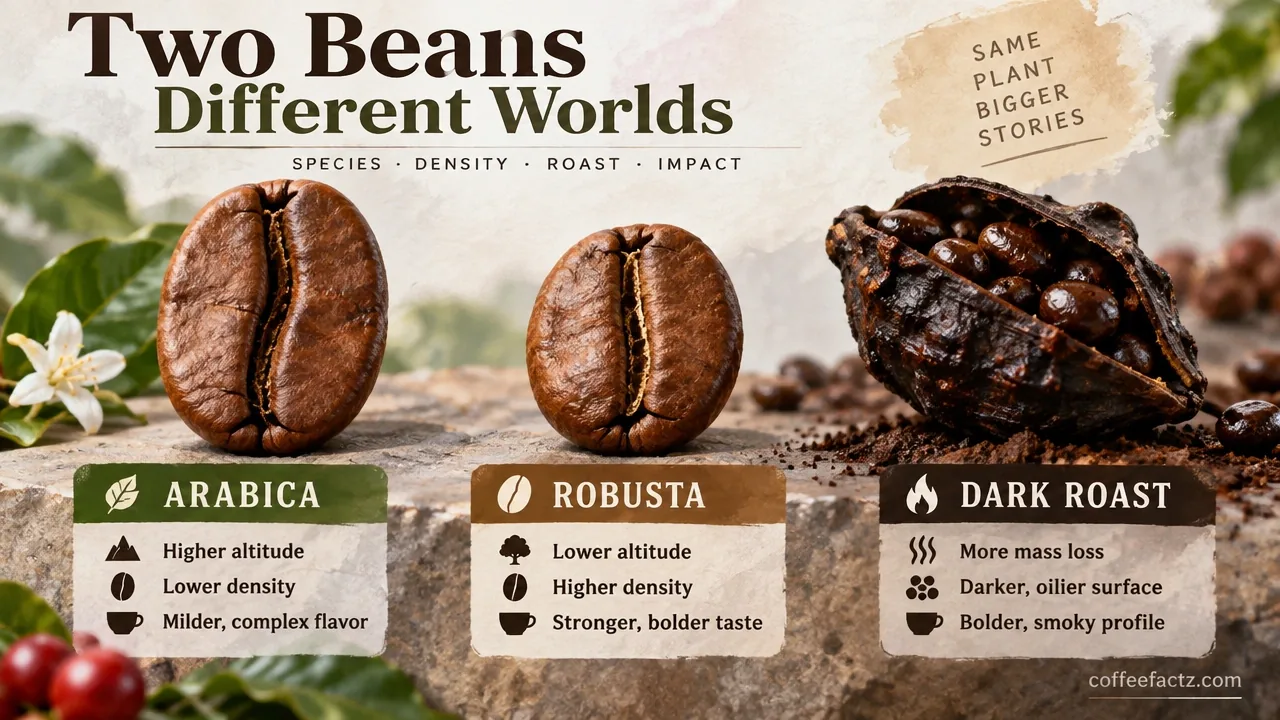
Robusta beans carry roughly twice the caffeine of Arabica by mass, with some variety-dependent comparisons pushing toward 3x in community reports. Treat the exact multiplier as species- and lot-dependent. What’s consistent is the direction: if a pod uses Robusta or a Robusta blend, its caffeine ceiling is structurally higher before roast or brew enters the picture.
The dark roast myth is persistent and specific. Darker roasts lose mass during roasting through moisture and CO₂ release. Caffeine itself doesn’t burn off at typical roasting temperatures; it’s heat-stable enough to survive the process largely intact. But the bean shrinks. So by mass, a dark roast bean carries roughly the same caffeine as a light roast bean of the same species, and because the dark bean is lighter, a gram-for-gram comparison actually gives light roast a slight edge.
Here’s where the confusion enters: espresso roasts and dark blends often get labeled “strong,” and they are strong in flavor. Bitterness and intensity read as strength. But if two pods contain the same mass of the same species, the darker pod does not deliver more caffeine. The exception is engineering: a manufacturer who packs more coffee mass into a dark-roast pod, or blends in Robusta, can produce a higher-caffeine dark pod. Some do exactly that.
Brew Mechanics and Serving Volume
Extraction kinetics determine how much caffeine actually reaches your cup. The key variables are water temperature, flow rate, grind particle size, contact time, and brew volume. They don’t operate independently.
A peer-reviewed study in Foods that tracked caffeine extraction across ten consecutive brew fractions under controlled conditions found that flow rate had the strongest influence on caffeine mass in the cup. Higher flow rates reduced total caffeine yield. Finer grinding increased particle surface area and enabled higher extraction, while pressure and flow rate are linked through fluid dynamics: higher pressure tends to increase flow rate, which can actually reduce total caffeine extracted per gram of coffee.
That last point inverts what most people assume. Faster water through the puck means less contact time, which means less caffeine pulled. The study also noted that temperature effects were smaller than flow rate effects and partly interactive with grind size.
Brew volume adds another layer. A 10-oz pour from the same pod may extract roughly 1.5x more total caffeine than a 4-oz pour, not 2.5x. The water extracts what it can during contact time, then the rest is dilution. More water doesn’t linearly unlock more caffeine. It spreads the same extraction across a larger volume, which lowers concentration while modestly increasing total yield.
The Complete K-Cup Caffeine Chart: Baselines, Light Roasts, Engineered Boosts, and Extreme Pods
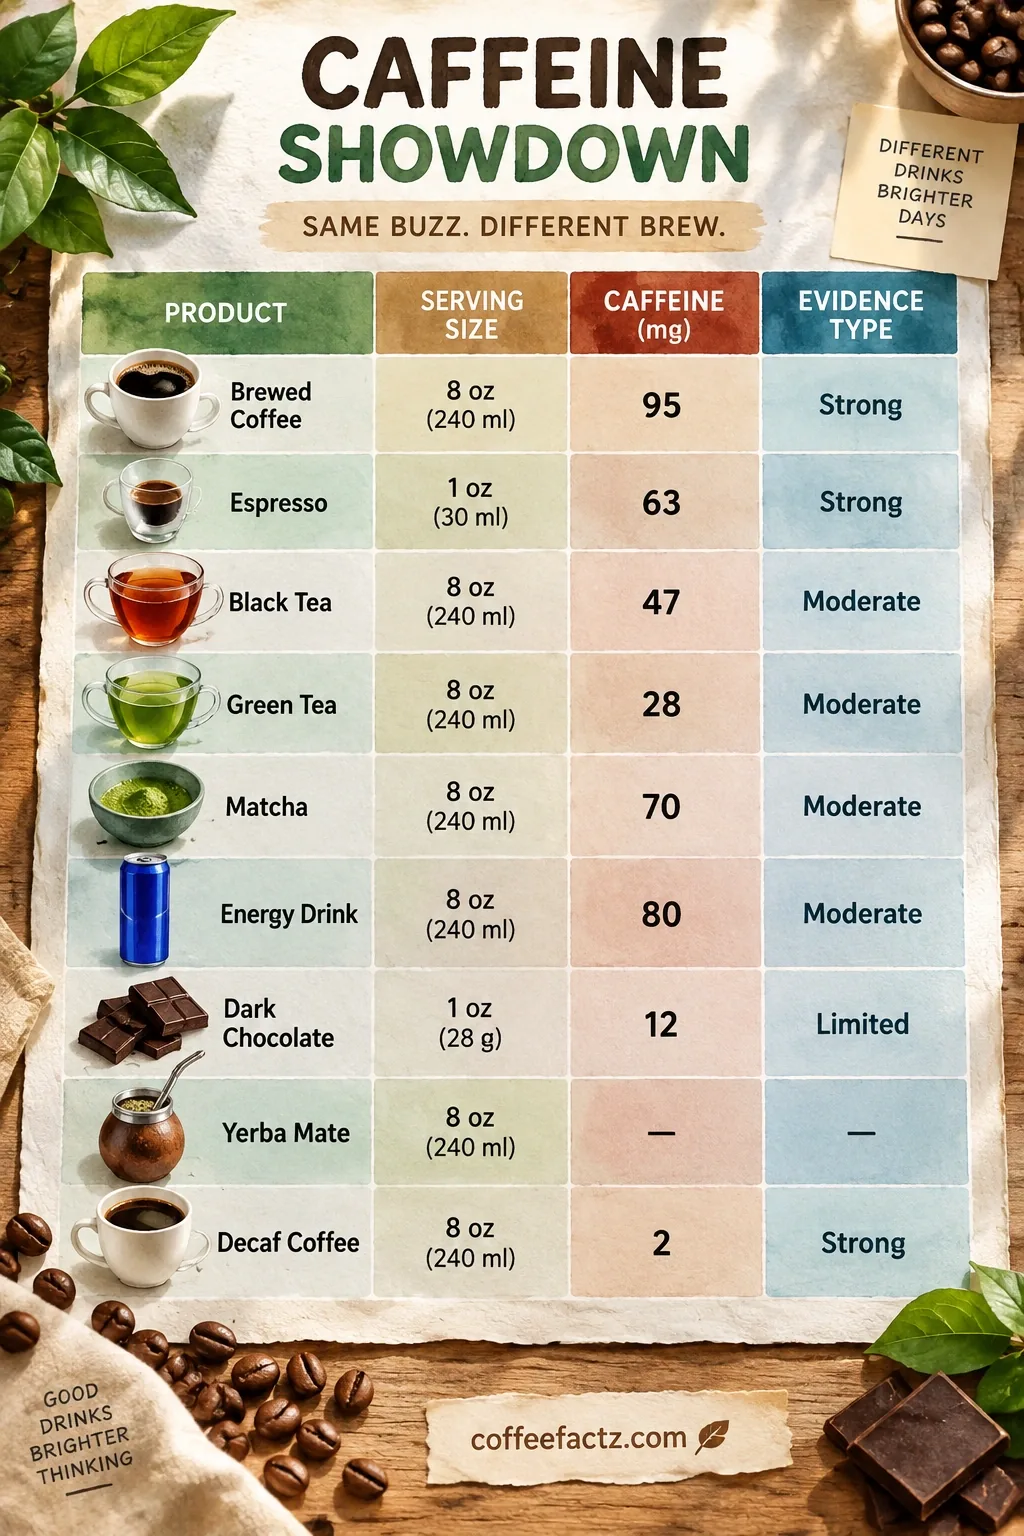
A K-Cup caffeine chart is only as useful as its honesty about evidence quality. The table below separates manufacturer claims from estimates and community reports. Where a specific figure isn’t verifiable, the range is listed with its evidence type. Do not treat any row as a lab measurement unless it says so.
Standard Reference Products and Evidence Labels
Eight O’Clock Original K-Cup serves as the baseline reference pod: a standard Arabica medium roast in the typical 9–11g dose range, landing in the middle of the standard 75–150 mg window. Its specific per-pod figure is a manufacturer estimate; no independent lab extraction data is publicly available.
Green Mountain Breakfast Blend illustrates the light-roast lift. Light roasts are denser by mass than dark roasts, so gram-for-gram they carry slightly more caffeine. Green Mountain positions Breakfast Blend at the upper end of the standard range. Exact milligrams are manufacturer estimates.
| Brand / Product | Serving Size | Caffeine (mg) | Evidence Type |
|---|---|---|---|
| Decaf K-Cup (any brand) | 8 fl oz | 2–4 | Manufacturer estimate |
| Herbal tea K-Cup | 8 fl oz | 0 | Category standard |
| Specialty beverage pods | 8 fl oz | Up to 60 | Manufacturer estimate |
| Tea K-Cup (black/green) | 8 fl oz | 50–75 | Manufacturer estimate |
| Eight O’Clock Original | 8 fl oz | ~75–100 | Manufacturer estimate |
| Green Mountain Breakfast Blend | 8 fl oz | ~100–120 | Manufacturer estimate |
| Standard medium roast K-Cup | 8 fl oz | 75–150 | Category range |
| Starbucks 2X Caffeine K-Cup | 8 fl oz | ~260 | Manufacturer claim |
| Wake The Hell Up K-Cup | 12 fl oz | 300–350 | Manufacturer claim |
| Death Wish Coffee K-Cup | 12 fl oz | ~728 | Manufacturer claim |
| Devil Mountain Black Label K-Cup | 12 fl oz | ~1,555 | Manufacturer claim |
The chart’s purpose is comparison on consistent assumptions, not precision. Every figure in the standard range reflects the same structural limitation: no mandated third-party testing, variable brew conditions, and natural bean variability baked in.
High-Dose Products and Specialty Beverages
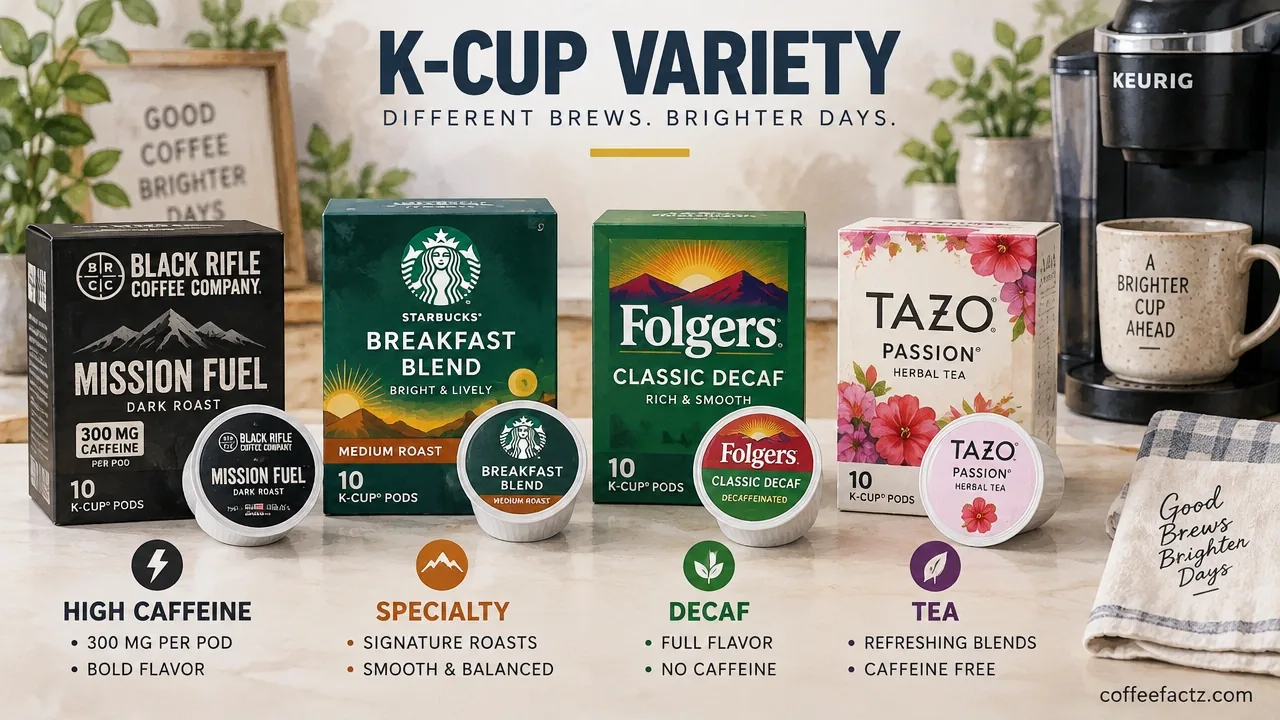
Starbucks 2X Caffeine K-Cup at approximately 260 mg represents engineered boosting through Robusta blending and higher coffee mass. It’s a legitimate single-dose jump, but at 260 mg it already consumes 65% of the general adult daily ceiling in one cup.
Death Wish Coffee at roughly 728 mg per 12-oz brew and Devil Mountain Black Label at approximately 1,555 mg per 12-oz brew are in a different category entirely. A single pod of either exceeds the general adult daily limit. Wake The Hell Up at 300–350 mg sits below that threshold but still represents a large single dose.
Users specifically ask for exact per-pod caffeine on these products, and the honest answer is that package labels provide the only available figures. Independent lab verification for most of these products isn’t publicly documented.
Brew Size, the Strong Button, and Concentration: Why 6–10 oz Beats 12 oz for Coffee Pods
Coffee pod concentration is where practical brewing decisions live, and the math here runs counter to instinct. More water does not equal more caffeine in a simple linear relationship. The pod contains a fixed mass of coffee. Once that mass is largely extracted, additional water dilutes rather than adds.
Total Yield Versus Dissolved Strength
Total yield and dissolved strength move in opposite directions as brew size increases. A 10-oz brew from the same pod may yield roughly 1.5x more total caffeine than a 4-oz brew, but the concentration per ounce drops. You’re drinking more volume to get a modestly higher dose.
Brew size is not only a taste preference. It changes both the concentration you taste and the total caffeine you consume, though the relationship is not proportional. Choosing 12 oz over 6 oz from the same pod might add 20–30% more total caffeine while cutting concentration nearly in half. For health-conscious drinkers tracking daily intake, the 12-oz setting on a standard pod is the least efficient way to manage either flavor or dose.
Machine Pulse Behavior and Serving Advice
The strong button mechanism on Keurig machines is genuinely debated. Community threads and user tests suggest it either slows flow rate, changes the pulse pattern of water delivery, or extends extraction contact time. The exact mechanism varies by machine model. What’s consistent across reports: it tends to produce a more concentrated cup. Whether that translates to meaningfully more total caffeine or primarily to higher concentration in less volume depends on how your specific machine implements it.
The practical recommendation is straightforward. Use the strong button and stay at 6–10 oz for coffee pods. The 12-oz setting was designed for lighter beverages like tea or hot chocolate pods, where dilution is acceptable. For coffee, it pushes past the extraction sweet spot and dilutes what the pod already extracted at smaller volumes.
Safe Daily Limits for K-Cup Drinkers: 400 mg, 200 mg, Pregnancy, Sensitivity, and Timing
Caffeine safe daily limits exist as population-level guidelines, not personal prescriptions. The numbers matter, but they’re starting points that individual biology adjusts significantly.
General Adult Thresholds
The general adult ceiling is 400 mg of caffeine per day, with a single-dose ceiling of 200 mg, for most healthy adults. The FDA has cited 400 mg/day as the amount not generally associated with negative effects, while noting wide variation in both sensitivity and elimination rate. Older references sometimes cited 400–600 mg/day, but 400 mg is the practical ceiling this guide applies, because it’s the figure supported by current federal guidance and because it leaves room for caffeine from non-coffee sources: chocolate, tea, medications, and energy drinks all add to the daily total.
At 75–150 mg per standard pod, the 400 mg ceiling translates to roughly 3–5 standard K-Cups per day, depending on brew size and pod type. A single Death Wish or Devil Mountain pod blows through that ceiling before you’ve finished your first cup.
Gestational and Metabolic Caveats
Pregnancy drops the limit to 200 mg/day. That’s a hard reduction backed by obstetric guidance, because caffeine crosses the placenta and the fetal liver can’t metabolize it efficiently.
Individual sensitivity produces the widest variation outside of pregnancy. Some people experience anxiety, elevated heart rate, or disrupted sleep from doses well under 100 mg. Sensitive users may notice effects from just a few sips of a standard pod. High-caffeine specialty pods like Death Wish and Devil Mountain don’t belong in a sensitive person’s rotation at all. The mg count on the label is a ceiling, not a guarantee that your body will handle it without consequence.
Bedtime Cutoff and Filter Chemistry
Caffeine timing matters as much as total dose. The average caffeine half-life is approximately 5 hours, which means half of a 3 PM cup is still active at 8 PM. But half-life varies significantly by genetics. Fast metabolizers carrying certain CYP1A2 gene variants process caffeine in roughly 3–4 hours. Slow metabolizers take 7–10 hours or longer. A practical rule that covers most people: stop caffeine at least 8 hours before your target sleep time.
One additional note for health-conscious pod drinkers: paper-filtered coffee reduces the concentration of diterpenes like cafestol and kahweol, compounds that raise LDL cholesterol in unfiltered brewing methods like French press or boiled coffee. Most K-Cup pods use a paper or paper-backed filter inside the pod, which provides a similar filtering effect. If cardiovascular health is a specific concern, that filter design is a genuine advantage over unfiltered methods.
Your K-Cup Caffeine Protocol: Calculate, Cap, and Choose Without Guessing
A repeatable K-Cup caffeine protocol closes the loop between the formula, the chart, the brewing mechanics, and your personal limit. Here’s how to run it.
Step 1: Identify the pod. Check the packaging for coffee mass (grams) and bean type. If listed, you have inputs for the formula. If not, locate the manufacturer’s published caffeine estimate and label it as such.
Step 2: Estimate caffeine. Use the formula: coffee dose (g) × bean caffeine concentration (%) × extraction efficiency. For a standard 10g Arabica pod at 1.3% concentration and 75% extraction efficiency, that’s roughly 98 mg. Adjust the concentration estimate up for Robusta blends. Treat the result as an estimate, not a lab measurement.
Step 3: Check against the chart. Does your estimate align with the brand’s published range? If you’re brewing Starbucks 2X, that single pod already sits at 260 mg, which is 65% of the daily adult ceiling.
Step 4: Adjust brew size and strong button. Stay at 6–10 oz for coffee pods. Use the strong button if you want higher concentration without increasing volume. Avoid 12 oz if you’re trying to maximize caffeine per pod.
Step 5: Cap daily total. 400 mg for most healthy adults. 200 mg if pregnant. Less if you know you’re sensitive. Count all caffeine sources across the day, not just pods.
Step 6: Time the last cup. At least 8 hours before bed. Longer if you’re a slow CYP1A2 metabolizer.
For three common drinker profiles: the baseline drinker using Eight O’Clock Original gets a reliable 75–100 mg per pod in a predictable medium-roast package. The light-roast seeker using Green Mountain Breakfast Blend sits at the upper end of the standard range, likely 100–120 mg, with a cleaner, brighter flavor profile. The engineered-boost user reaching for Starbucks 2X at 260 mg should count that as a large single dose and plan the rest of the day accordingly, staying under 140 mg from all other sources to keep the daily total at or below 400 mg.
For Death Wish, Devil Mountain, and Wake The Hell Up: one pod can exceed or eliminate your entire daily budget. These aren’t daily drivers for most people. They’re situational tools that require tracking everything else you consume that day.
The honest conclusion on exact per-pod caffeine: it’s rarely knowable with precision. What’s always knowable is your daily ceiling, your brew mechanics, and your personal response. Estimate with the formula, anchor with the chart, and let your daily cap do the actual safety work.
Frequently Asked Questions About K-Cup Caffeine Levels
How much caffeine is in a Starbucks K-Cup?
The standard Starbucks K-Cup varieties fall within the 75–150 mg range, but the Starbucks 2X Caffeine K-Cup is specifically engineered to deliver approximately 260 mg per serving through a Robusta blend and higher coffee mass.
Is 150 mg of caffeine a lot from a K-Cup?
It’s at the high end of a standard pod but well within the 400 mg adult daily ceiling. Where it becomes significant is if you’re sensitive to caffeine, pregnant, or stacking it with other caffeine sources across the day.
Does Keurig coffee hit as hard as espresso?
Not typically. A standard K-Cup brews at lower pressure than an espresso machine, which affects extraction efficiency and concentration. Espresso delivers 60–75 mg in a 1-oz shot at very high concentration; a K-Cup spreads a similar or larger total caffeine dose across 6–12 oz, so the per-sip intensity is lower.
How much caffeine is in a Nespresso double espresso pod?
Nespresso double espresso capsules generally deliver 120–200 mg depending on the specific capsule line, with the Nespresso Vertuo double espresso pods designed for roughly 180–200 mg per serving. K-Cups and Nespresso pods aren’t directly comparable because the machines use different pressures and pod formats.
Why does my K-Cup taste stronger at 6 oz but feel the same caffeine-wise as 10 oz?
Taste strength reflects concentration, which is higher at smaller volumes. But total caffeine yield does increase modestly with larger brew sizes because more water extracts a bit more from the grounds. The difference in total caffeine between 6 oz and 10 oz from the same pod is real but not proportional, likely around 1.3–1.5x, not 2x.
Can I use two K-Cups in one brew cycle to double my caffeine?
Most Keurig machines aren’t designed for double-pod brewing, but some users run a second pod through the same cup. This roughly doubles the coffee dose and caffeine, which can push a single serving past 200–300 mg depending on the pods. That’s a large single dose and worth tracking against your daily limit.
Do reusable K-Cup pods change the caffeine level?
Yes. Reusable pods let you control grind size, coffee mass, and tamping, all of which affect extraction. Finer grind and more coffee mass increase available caffeine. Without standardized pod engineering, your extraction efficiency also becomes less predictable than with a sealed commercial pod.
Why do extreme pods like Devil Mountain claim such high caffeine numbers?
High-caffeine pods achieve those numbers through Robusta-heavy blends, higher coffee mass per pod, and finer grinds optimized for maximum extraction. Devil Mountain’s 1,555 mg figure is a manufacturer claim for a 12-oz brew and hasn’t been independently lab-verified publicly, but the mechanism that produces it, more Robusta at higher dose, is physically consistent with that range.
References
- A Caffeine Calculator | calmcoffeeroastery.co.uk
- Spilling the Beans: How Much Caffeine Is Too Much | fda.gov
- Influence of Flow Rate, Particle Size, and Temperature on Espresso Extraction Kinetics | mdpi.com